The UCI is the first index of qualitatively distinct types of corruption across regions, using structured surveys of country experts.
Blog
We made a data viz tool tracking enforcement against corruption in the UK. Here’s what we learned.
Findings and lessons from Spotlight on Corruption’s Anti-Corruption Enforcement Tracker – and how other researchers and campaigners could apply them.

This is the 13th in a blog series on anti-corruption measurement tools and their applications. Contributors include leading measurement, evaluation, and corruption experts invited by U4 to share up-to-date insights during 2024–2025. CC BY-NC-ND
Finding official data on anti-corruption enforcement in the UK is far from easy. While the UK government publishes relatively detailed data, it is often buried deep in hard-to-access spreadsheets (with some notable exceptions, like asset recovery statistics or the data annex for the Economic Crime Plan 2).
Inspired by other similar initiatives (such as those from Stanford Law School or Mintz Group) we made a data visualisation tool that sheds light on the UK’s track record of enforcement against corruption and related economic crimes. The result – our Anti-Corruption Enforcement Tracker – helps campaigners build an evidence base for reform of anti-corruption enforcement, provides journalists and members of the public with accessible and clear statistics, and encourages the government to collect and publish its data in more accessible and accurate ways.
The Anti-Corruption Enforcement Tracker – helps campaigners build an evidence base for reform of anti-corruption enforcement, provides journalists and members of the public with accessible and clear statistics, and encourages the government to collect and publish its data in more accessible and accurate ways.
In the months since its launch in April 2025, it has been used hundreds of times across 60 countries, and we have had positive feedback from parts of the UK government, law enforcement, parliament, and academia. The tracker has already been used by members of parliament to support their scrutiny of the government. We hope that as the tracker covers new ground and is updated with the latest annual statistics, it will only become more useful.
How the Anti-Corruption Enforcement Tracker works
We worked with a data visualisation expert to make simple, clear charts and graphics from official datasets, preparing the data with Python and R and using the D3 JavaScript library to create the visualisations. The tracker provides unique insights on over a decade of anti-corruption-related enforcement in the UK.
The tracker reveals striking declines in prosecutions and convictions for corruption-related offences over the last decade in the UK.
The tracker draws from three official datasets. The first, published by the UK Ministry of Justice, consists of spreadsheets on annual prosecutions and convictions for criminal offences in England and Wales. These can be filtered using pivot tables, allowing the tracker to display data on prosecutions and convictions for money laundering, misconduct in public office, bribery, and fraud offences relating to corruption. The second, published by the UK Home Office, features data on asset recovery in England, Wales, and Northern Ireland. The third dataset comes from annual reports, published by the UK Treasury, on anti-money laundering (AML) supervision in England, Scotland, Wales, and Northern Ireland. (At the time of writing, the tracker only includes data on fines for AML breaches but this will soon be expanded to include other sanctions and punishments).
Key trends revealed by the Anti-Corruption Enforcement Tracker
The tracker reveals striking declines in prosecutions and convictions for corruption-related offences over the last decade in the UK when they were the most serious offence for which a defendant was prosecuted. Money laundering prosecutions decreased by 36.1% between 2013/14 and 2023/24, while overall fraud prosecutions went down 74.8% in the same period.
Figure 1. Overall money laundering prosecutions and convictions in England and Wales where money laundering was the most serious offence
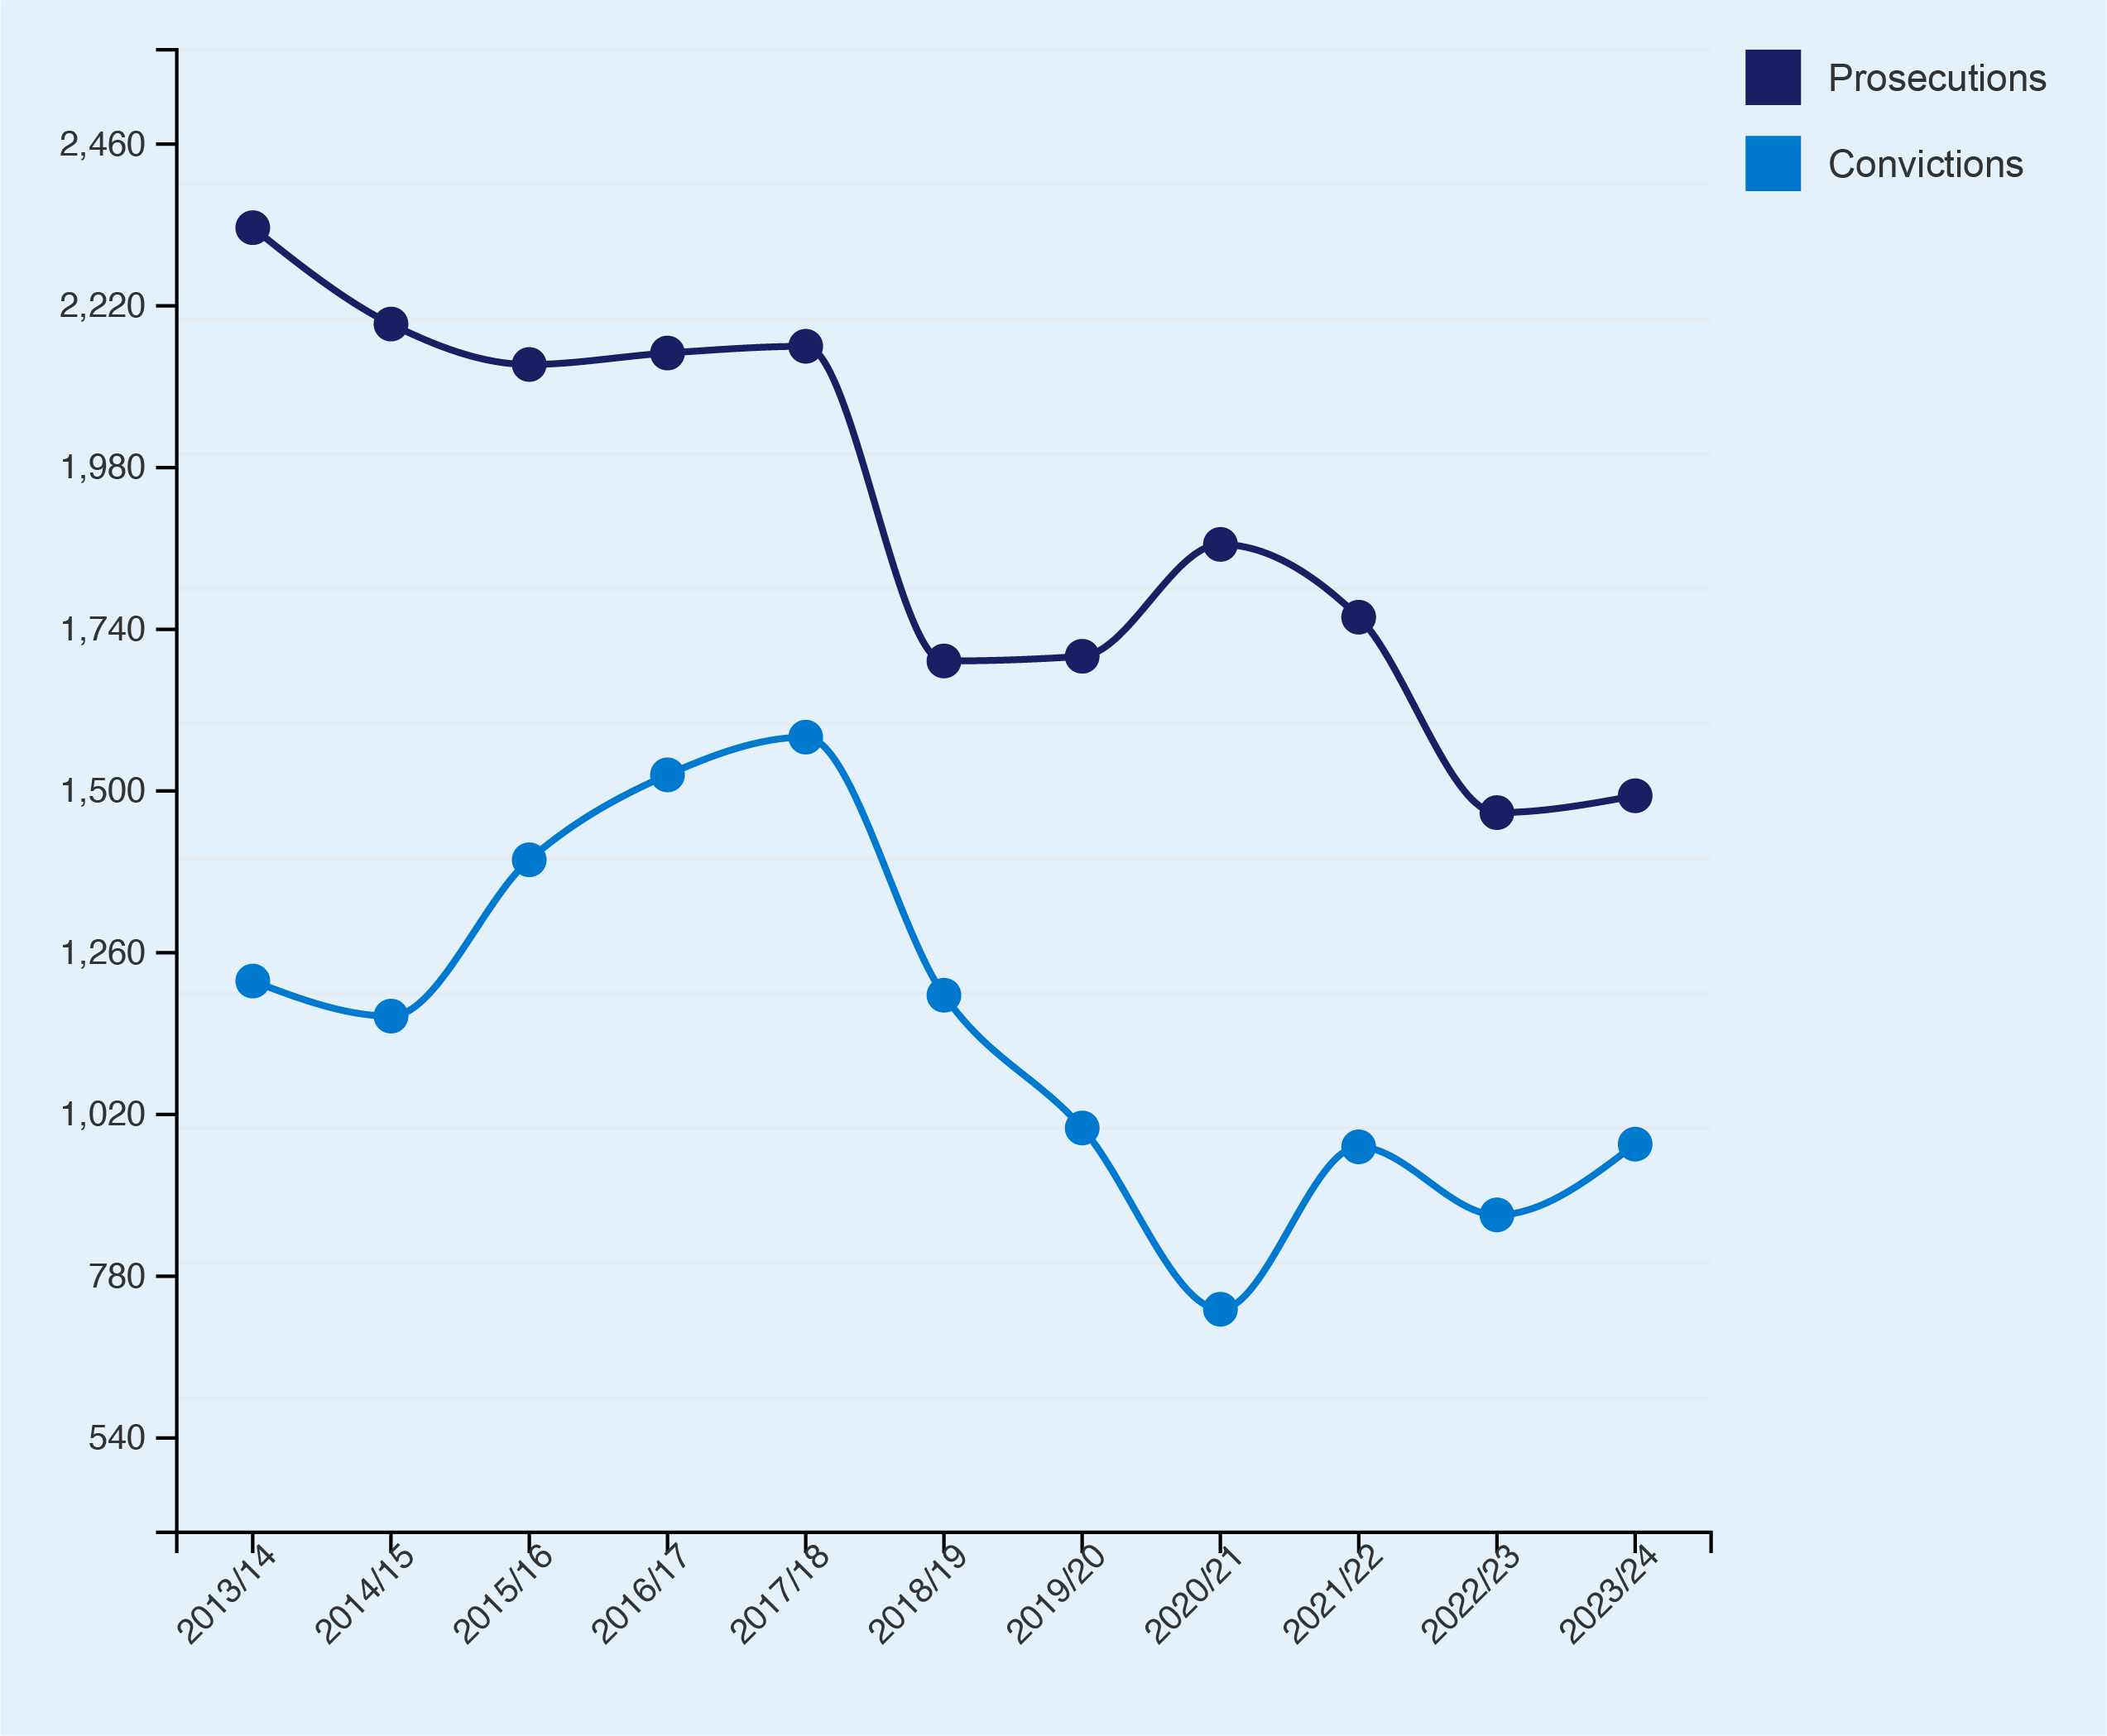
Overall money laundering prosecutions and convictions where money laundering was the most serious offence.
Credit: Criminal Justice Statistics, June 2024. by-nc-nd
The picture is more encouraging for asset recovery, with the tracker showing that total recovered assets in 2023/24 went up over 35% since 2013/14. However, the roughly £243 million recovered in 2023/24 represents just 0.2% of the £100 billion a year the UK’s National Crime Agency assesses could realistically be laundered through the UK. With the UK government’s latest National Risk Assessment for money laundering highlighting the UK’s high risks of exposure to the proceeds of corruption and kleptocracy, this is a real cause for concern.
Figure 2. Total assets recovered in England and Wales (value recovered in millions of GBP, £m)
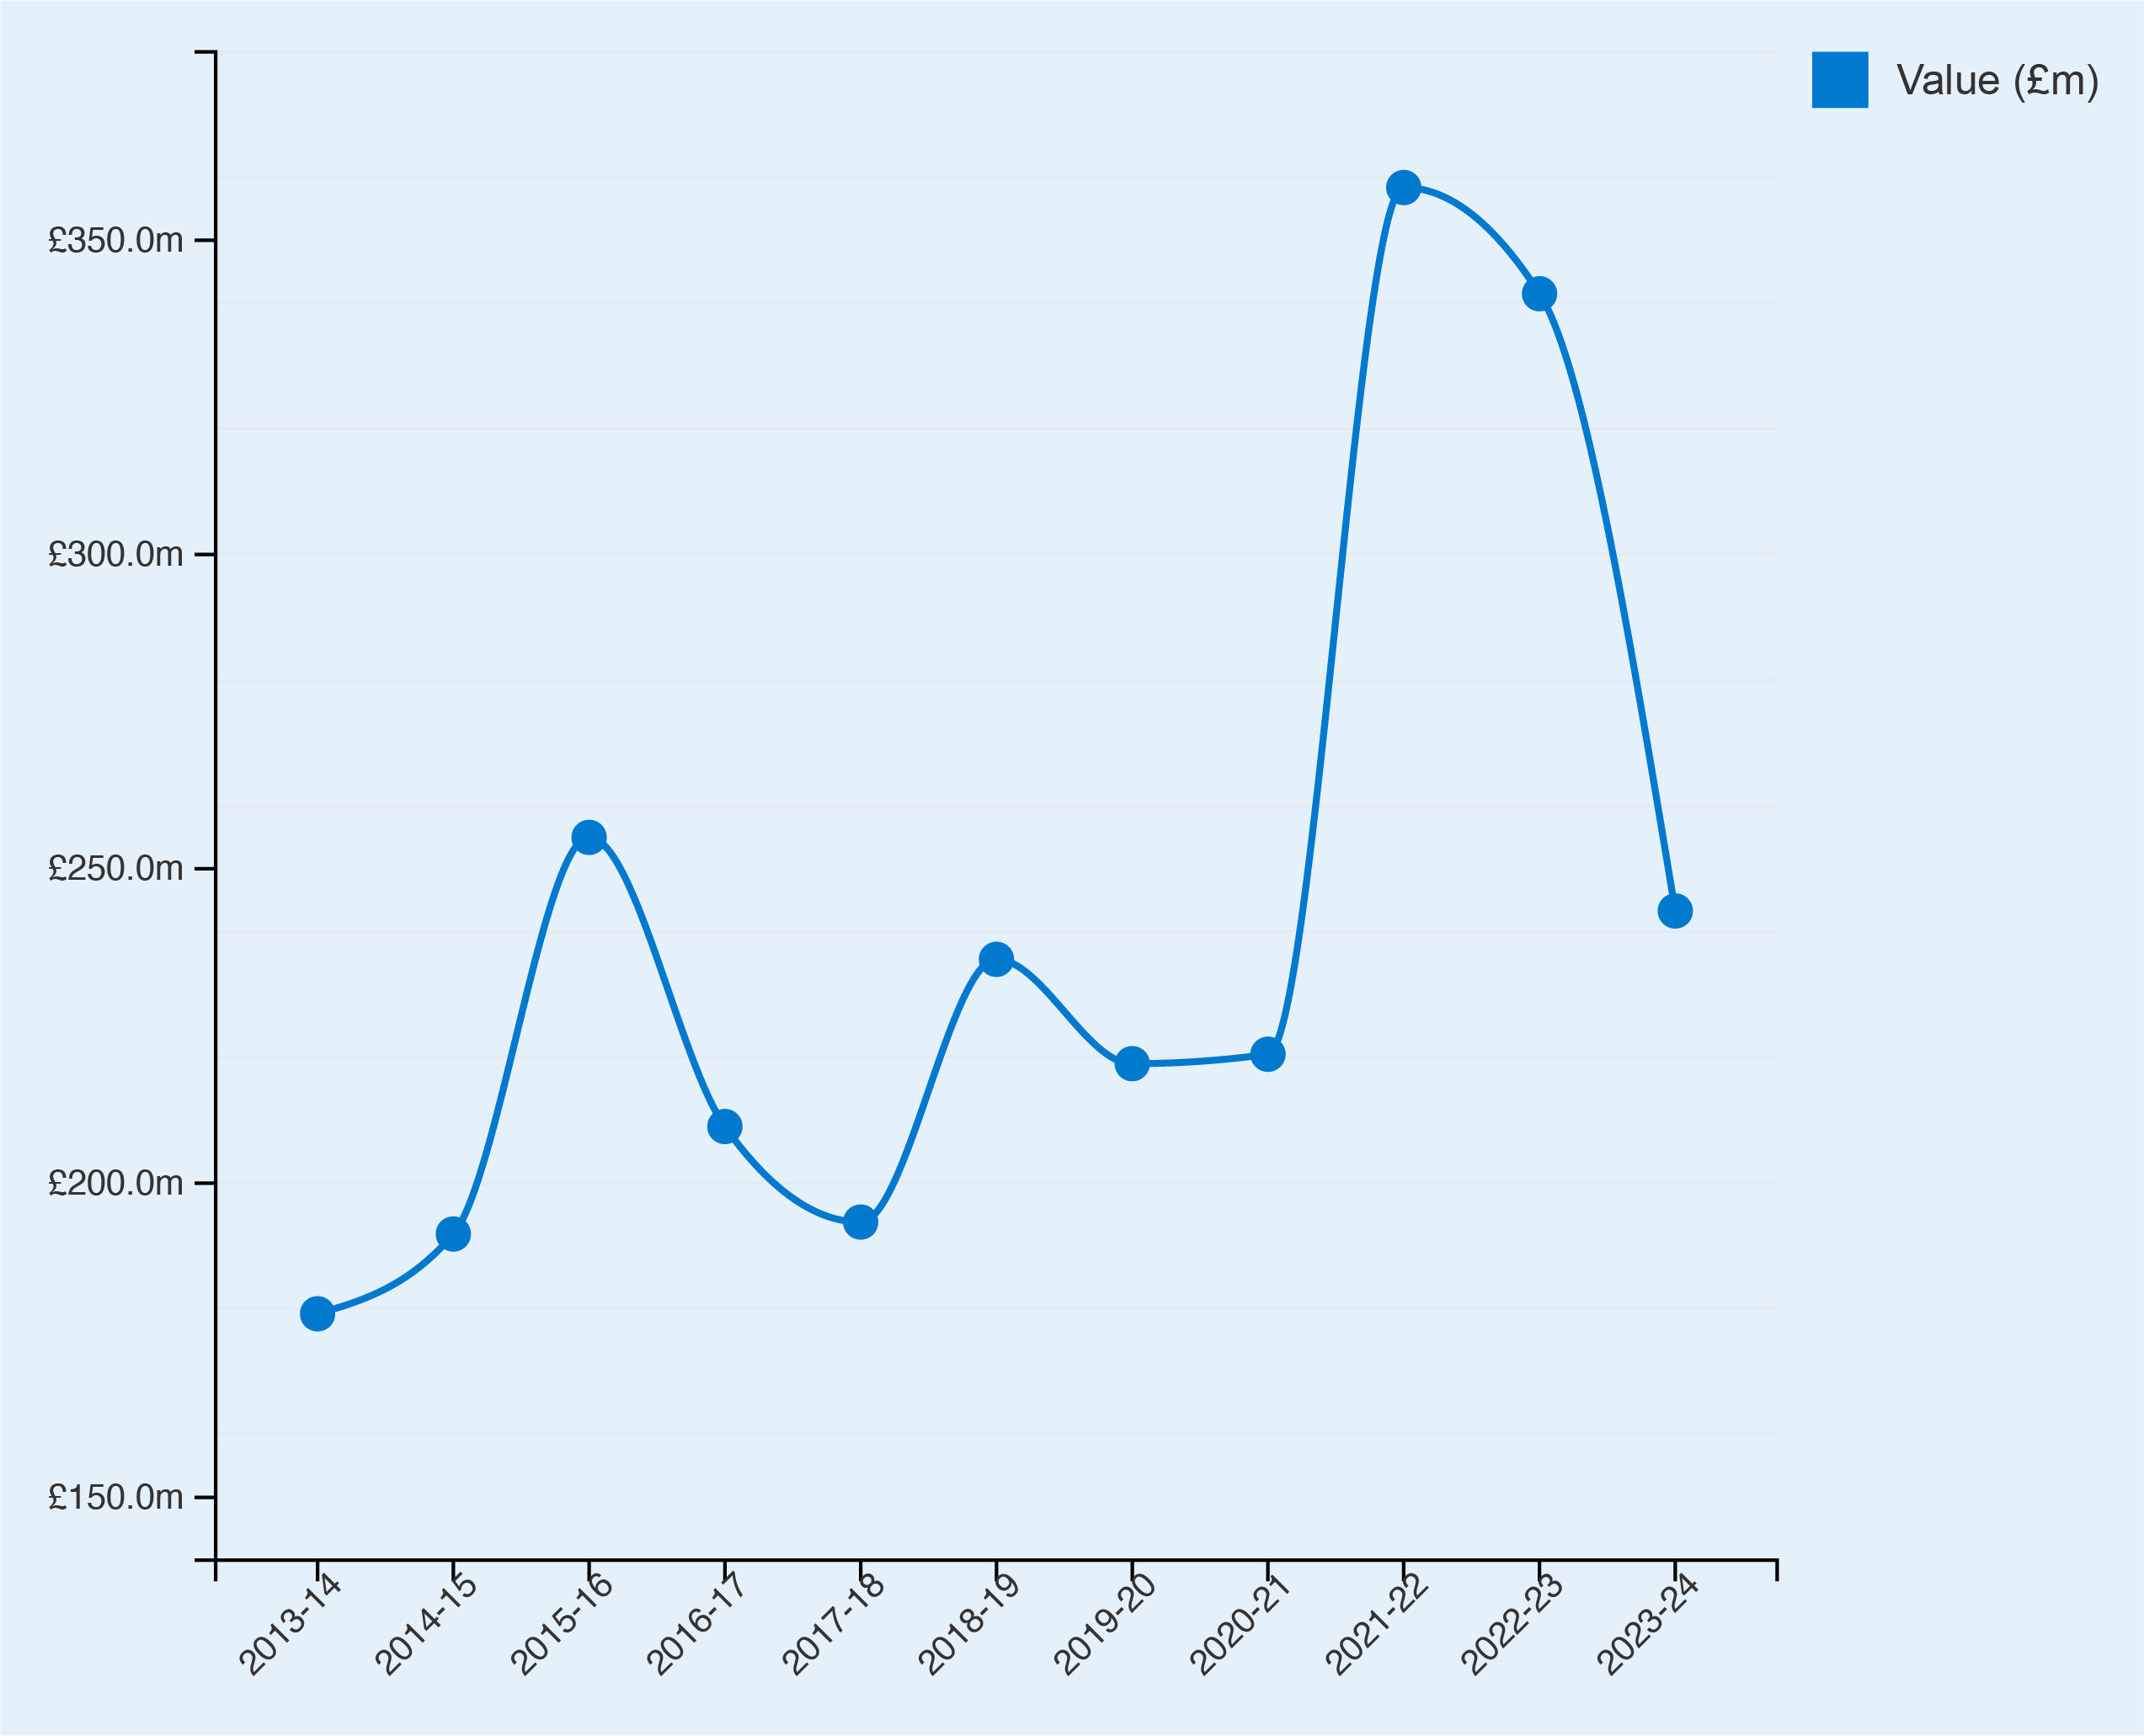
Credit: Annual Asset Recovery Statistical Bulletin Series by-nc-nd
Limitations of the Anti-Corruption Enforcement Tracker
It is important to acknowledge the tracker’s limitations, not least because doing so may help anyone attempting to develop their own tracker in another jurisdiction.
1. Trends can be misleading
Trends only give part of the picture; more prosecutions and more convictions is not necessarily better. Convictions of several money mules may have less long-term impact than enforcement against a single professional enabler who launders vast proceeds of corruption. Similarly, in many jurisdictions anti-corruption enforcement can be weaponised to repress political opposition, meaning an increase in prosecutions and convictions is not always a welcome trend. Analysing individual cases alongside trends is therefore critical to gaining a comprehensive understanding of how effectively law enforcement is addressing corruption.
2. Definitional challenges
Corruption is a broad concept that is notoriously hard to pin down. Clearly the data in the tracker does not cover the whole range of corruption-related wrongdoing. In some cases, the data in the tracker will not directly relate to corruption (for example, money laundering prosecutions in which corruption is just one of many possible predicate offences). The tracker therefore focuses on key indicators and proxies for anti-corruption-related enforcement activity that are publicly available and recorded on a national basis by the UK government.
3. Shortcomings and gaps in the data
Take a close look at the tracker and you will probably spot data gaps. For instance, there is no data on individual cases or enforcement by specific agencies, nor is there any data (yet) on sanctions enforcement, AML supervision, Suspicious Activity Reports, or asset freezes. While we intend to address some of these gaps, we had to limit the scope of the tracker to strike a balance between providing a useful amount of data without overwhelming users with complex statistics.
Another key challenge was deciding which datasets to use. For instance, there are two main criminal justice datasets for England and Wales which both contain useful but different information; we only had space to include data from one of these datasets. The first records the overall number of defendants but only counts the most serious offence which they faced. The second includes all offences that were prosecuted, but does not show the number of defendants (as many are prosecuted for multiple offences).
We wanted to highlight the overall number of individual defendants for key offences, so opted mostly to use the former dataset. But this means the tracker does not include all instances where the offences in question were prosecuted (except for money laundering, where we used both datasets as this offence appears as a secondary offence more often than the others). The tracker also relies upon the official data we use being accurate and published in a timely manner – not always a given.
Anyone attempting a tracker in another jurisdiction is likely to face similarly challenging trade-offs and would need to make a judgement as to whether the official data is reliable and detailed enough to be used.
The role and future of the Anti-Corruption Enforcement Tracker
We believe our Anti-Corruption Enforcement Tracker helps enrich public understanding of the UK’s efforts to enforce against corruption by providing an accessible and unique visualisation of complex data. We hope it inspires the creation of other trackers and the publication of more official data in the UK and elsewhere that enables closer scrutiny of global anti-corruption enforcement.
Anti-corruption measurement series
This blog series looks at recent anti-corruption measurement and assessment tools, and how they have been applied in practice at regional or global level, particularly in development programming.
Contributors include leading measurement, evaluation, and corruption experts invited by U4 to share up-to-date insights during 2024–2025. (Series editors are Sofie Arjon Schütte and Joseph Pozsgai-Alvarez).
Explore the other blogs in the series.
Sign up to the U4 Newsletter to get updates, or follow us on LinkedIn.
Disclaimer
All views in this text are the author(s)’, and may differ from the U4 partner agencies’ policies.
This work is licenced under a Creative Commons Attribution-NonCommercial-NoDerivatives 4.0 International licence (CC BY-NC-ND 4.0)
Keywords
Photo
CC BY-NC-ND