
From systemic to targeted anti-corruption
Since the rise of the ‘good governance’ agenda in the mid-1990s, international development organisations have identified corruption as the ‘single greatest obstacle to economic and social development’.e6d29237ce87 They have devoted an increasing share of their aid budgets to combating graft in developing and transition countries.bf6896dec2f2 In line with this trend, donor agencies in Albania – an aid-receiving, post-socialist country in the Western Balkan region – routinely present corruption as the country’s ‘main problem, overshadowing… unemployment, crime and low wages’.595f23c0cccc Corruption reduction has also emerged as an explicit condition for the opening of negotiations around Albania’s accession to the European Union (EU).
In countries around the world, aid-funded anti-corruption initiatives are typically grounded in a ‘systemic’ approach that seeks to establish centralised anti-corruption safeguards.0a0b5e0a8478 Some distinctive elements of the systemic approach include interventions to support anti-corruption commissions, specialised courts, supreme audit agencies, and ombudspersons; awareness raising and training of public officials; and establishing beneficial ownership registers. The aim is to create or strengthen an overarching legal, institutional, and organisational framework for the prevention or reduction of corruption across the board.
Recent thinking, however, points to the inevitable political and economic constraints that stand in the way of a systemic reduction in corruption, at least until a country has reached a threshold level of economic development.0e1b013d136f First, given the cost of enforcement, it is difficult for developing countries to improve general enforcement of the rule of law until they have achieved a fairly high level of per capita income.510a82e01572 With the possible exception of Georgia, very few developing countries have launched anti-corruption programmes that have succeeded in substantially reducing the overall prevalence of corruption before the country reaches upper-middle-income status. Second, in many countries, corruption is embedded in the logic by which the ruling coalition (typically, a coalition of political parties) maintains power.2e2cd9459d95 For this reason, it may be irrational for politicians to provide genuine support for anti-corruption reforms, as successful implementation would curtail their ability to buy support from influential groups in order to ensure their political survival.
In line with this view, recent impact assessments indicate that, with a few notable exceptions, donor-led anti-corruption efforts have by and large failed to achieve their stated aim of reducing corruption significantly in aid-receiving countries.a19dc6f7158b
The patchy track record of systemic anti-corruption, however, does not imply that this broad approach is entirely irrelevant. As a country transitions to a higher level of development, some of the structural constraints on systemic anti-corruption efforts will be eased. Once that happens, traditional strategies aiming to curb corruption across the board become more relevant and may even be preferable to the targeted approaches advocated in this issue paper. Yet in the short to medium term, focusing on systemic interventions exclusively, or even primarily, may lead to continued frustration.
We argue that systemic anti-corruption strategies, at the very least, should be complemented by more targeted interventions that do not rely on a country’s ability to enforce a set of overarching anti-corruption institutions and practices. Such targeted interventions are confined to a specific space, such as an economic sector or a governance realm. But ‘targeted’ also implies certain additional qualities: interventions should be both feasible and high-impact given the specific context of the target country, including its level of development.0d94795baef3 For practitioners, the challenge is to identify interventions that will face the least political or social resistance and are also likely to have the most impact on economic and human development. Although less ambitious than systemic interventions, targeted interventions are likely to be subject to fewer implementation constraints. They are also likely to deliver more tangible benefits to the target country while enhancing aid effectiveness. Furthermore, aid spending is subject to a hard budget constraint. Donors’ headquarters and field offices are often called to make tough choices about which objective or type of spending to prioritise. In a world where ‘second-best’ choices cannot be avoided, a framework for targeting anti-corruption policies can be a very useful programming tool for donors.
A stepwise framework
The need for more targeted interventions to complement the systemic approach prompts two main questions for practitioners. First, how do we identify a ‘smart space’ (or ‘sector’) for anti-corruption interventions? And second, within that space, how do we identify the right set of anti-corruption policies and interventions? This U4 Issue provides a stepwise framework to help practitioners answer both questions, using Albania as an illustrative case.
To this end, the paper employs a multi-method approach that combines primary and secondary data analysis, unstructured interviews with practitioners in Albania, and desk research. The main source of primary data is an expert survey of 23 anti-corruption and good-governance specialists based in Albania, representing non-governmental organisations (NGOs), international organisations, government, and the media. They were asked to provide perception-based evaluations of corruption across 16 ‘corruption sectors’: justice, public-private partnerships, public procurement, civil service recruitment, party financing, tax and customs, ownership titling, voting, police, oil and mining licensing, education, construction licensing, health, environmental regulation, public utilities, and business registration. Designed by the authors, the survey was conducted online in July 2019. The analysis also draws on insights gathered in the course of a two-day anti-corruption workshop organised by U4 in Tirana, the capital city of Albania, in November 2019.
The sections below trace the analytical steps that practitioners should follow when designing targeted anti-corruption programmes and interventions. Step 1 consists of assessing corruption and anti-corruption trends and patterns in the target country. Thus, the paper begins by reviewing some of the existing evidence from Albania.
In Step 2, practitioners should select the corruption sector(s) to prioritise. We argue that finding a ‘smart space’ for anti-corruption interventions requires practitioners to estimate the relative feasibility and impact of targeting anti-corruption efforts to alternative sectors. To help them carry out this exercise, we present a set of heuristic devices broadly inspired by the anti-corruption evidence (ACE) framework developed by Khan, Andreoni, and Royedf7b45c7aa6 at the School of Oriental and African Studies (SOAS) in London.78f9c6f63bf9 We suggest that the feasibility of anti-corruption interventions depends on the distribution of political and economic power among the actors and groups that are involved in corrupt practices – that is, the targets of intervention. Impact, on the other hand, is related to the economic and social consequences of eradicating specific corrupt practices. Based on the expert survey, our paper identifies the corruption sectors in Albania where anti-corruption efforts are likely to be most feasible and impactful.
Step 3 involves mapping and evaluating specific corrupt practices within a promising corruption sector, classifying them, again, in terms of their impact – the extent to which they disrupt development outcomes in that sector – and their amenability to external interventions.
Next, in Step 4, practitioners reconstruct the state of play within the corruption sector of interest. In particular, they should record and assess any anti-corruption efforts launched to date, as well as any policies or reforms that may have, or have had, an indirect effect on the form and prevalence of corruption in the target sector.
Step 5 sets out a procedure to develop a comprehensive anti-corruption action plan for the sector. An effective plan, we argue, should identify a coherent set of interventions that are judged to be both impactful and feasible.
Lastly, in Step 6, practitioners generate quantitative empirical evidence, to the extent possible, before moving on to the implementation phase. Additional details that might be of interest to practitioners working in, or on, Albania are presented in the appendices.
Step 1: Assessing (anti)corruption trends and patterns
As a first step, practitioners should map corruption and anti-corruption trends and patterns in the target country. To guide the analysis, they can draw on the research questions presented in Checklist 1.
Checklist 1: Assess the context of intervention in the target country
- Overall, has corruption in the country increased, declined, or followed a level trend in recent years?
- Is corruption more prevalent in some regions/sectors than in others?
- What are the main consequences of (different kinds of) corruption?
- In this specific country context, what are the main causes of corruption?
- Who are the main drivers and funders of anti-corruption efforts?
- In recent years, have aid-funded programmes contributed to reducing corruption? If not, why not?
A post-socialist economy located in the Western Balkan region, Albania has a per capita income level of 11,617 PPP dollars,be534fbded7d0a4810912c82 comparable to Sri Lanka, Ecuador, or Tunisia. Its score on Transparency International’s Corruption Perceptions Index was 35 in 2019, similar to Algeria, Brazil, and Côte d’Ivoire.eae7065114dc A candidate for European Union (EU) membership, Albania is currently awaiting the opening of accession negotiations with the bloc. Unsurprisingly, donor strategies are largely geared towards helping Albania fulfil the requirements for EU membership.
In Albania, donor-funded anti-corruption efforts have been much more robust than in other developing and transition economies. During 2009–17, Albania received over US$27 million in foreign aid for anti-corruption initiatives (Table 1).edfb85cc733d This amount corresponds to $3.4 million a year – approximately three times as much as the equivalent flow for the average aid-receiving country. Since 2011, multilateral and bilateral donors have played an equally important role in this programme area. Although its relative contribution to anti-corruption funding has declined in recent years, the US Agency for International Development (USAID) remains one of the largest contributor to the anti-corruption budget, together with the EU. In Albania, the World Bank has not been active in anti-corruption since 2012.
Table 1: Anti-corruption spending by donor, Albania, 2009–2017
| Donor | US$ millions | % total |
| Total | 27.122 | 100.0 |
| USAID | 17.949 | 66.2 |
| EU | 7.680 | 28.3 |
| World Bank | 0.600 | 2.2 |
| AICS (Italy) | 0.462 | 1.7 |
| DFID (UK) | 0.220 | 0.8 |
| GiZ (Germany) | 0.035 | 0.1 |
| UNDP | 0.018 | 0.1 |
Source: OECD, International Development Statistics, 2019.
Note: The figures are for cumulative Overseas Development Assistance (ODA) disbursements for ‘anti-corruption organisations and institutions’ (sector code 15113).
Appendix A provides a brief and non-exhaustive history of the main aid-funded anti-corruption projects implemented in Albania since 2009. This appendix also discusses how the main anti-corruption laws and institutions were shaped or reformed by donor interventions. In line with the ‘systemic approach,’ donors so far have mainly focused on strengthening Albania’s legal and institutional framework for anti-corruption, even when working in specific corruption sectors such as health care or education.
Since 2000, and especially since 2012, perceived levels of corruption in Albania have steadily declined. As shown in Figure 1, this downward trend has taken place at a time of rapid economic growth, as the reestablishment of state authority in the aftermath of the 1997 civil conflict paved the way for improved economic and political stability.c837115cf0bb A decline in the magnitude of corruption was also accompanied by a change in its form: ‘what had been vulgar theft at border posts and ministries [before the 1997 unrest] became the sneaky domain of tenders and licenses’.ae18968bc33f In addition, the collapse of state authority in 1997 further undermined Albanians’ trust in public institutions, precipitating a surge in informal economic activity.
Figure 1: Corruption and economic development in Albania, 2002–2017
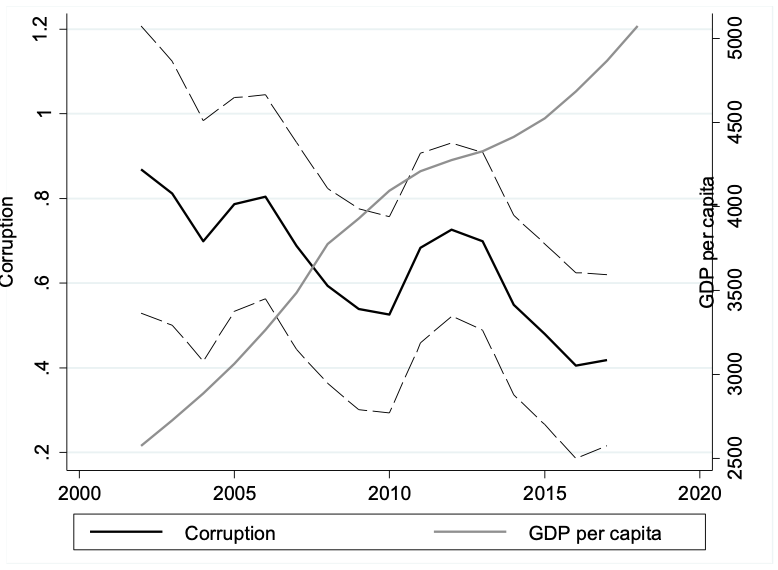
Sources: Corruption data: World Bank, Worldwide Governance Indicators, 2019, Control of Corruption index; GDP data: World Bank, World Development Indicators, 2019.
Note: The dotted lines denote the 90% confidence interval for the corruption index. The corruption index was inverted so that a higher value denotes more corruption. The GDP data are in constant US$.
This temporal association between corruption and income levels in Albania is in line with one of the most robust findings of the corruption literature: that richer countries are less corrupt because they are richer.f2d2829d62be In other words, one of the material consequences of economic development is a reduction in corruption across the boardbf28df11261b33a5beb6ea28 Although Albania’s corruption levels have been on an encouraging downward path, Albania remains one of the most ‘corrupt’ (and, indeed, poorest) countries in the Western Balkan region, as shown in Figure 2. Furthermore, the last three years have seen a notable uptick in perceived corruption levels.
Figure 2: Corruption levels in the six countries of the Western Balkan region, 2008–2018
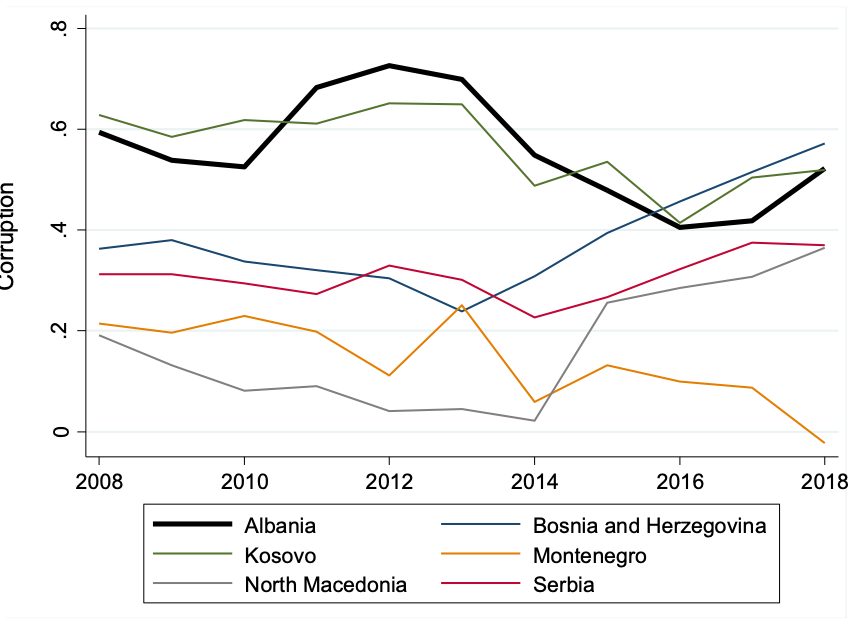
Source: World Bank, Worldwide Governance Indicators, 2019, Control of Corruption index.
That said, what are the factors behind the long-run decline in corruption levels observed in Albania (Figure 1)? In particular, how much of this decline can be attributed to purposive anti-corruption interventions, and how much to the broader structural changes that have accompanied Albania’s experience of economic growth post-1997? Have aid-funded anti-corruption initiatives been successful? These are challenging questions to answer, as it is difficult to conclusively link the observed outcome (i.e., declining corruption) to specific causal factors (e.g., anti-corruption interventions, economic growth).
In a bid to provide a tentative answer, Appendix B employs regression analysis to disentangle the relative importance of different causes of corruption in Albania. In particular, we look for a temporal relationship between corruption levels, anti-corruption aid disbursements, and gross domestic product (GDP) per capita (a standard indicator of the level of development). Because of data limitations, we can only focus on the period 2002–17. Once economic development and other relevant determinants of corruption are accounted for in the regression model (e.g., natural resource exports, remittances, elections), the analysis finds only a weak negative relationship between anti-corruption aid disbursements and corruption reduction. Although higher volumes of anti-corruption aid inflows in Albania are associated with lower levels of perceived corruption, this association is not always statistically significant. By contrast, the regressions reveal a robust, and fairly large, negative relationship between the prevalence of corruption and GDP per capita, as rising incomes correlate significantly and consistently with less corruption.
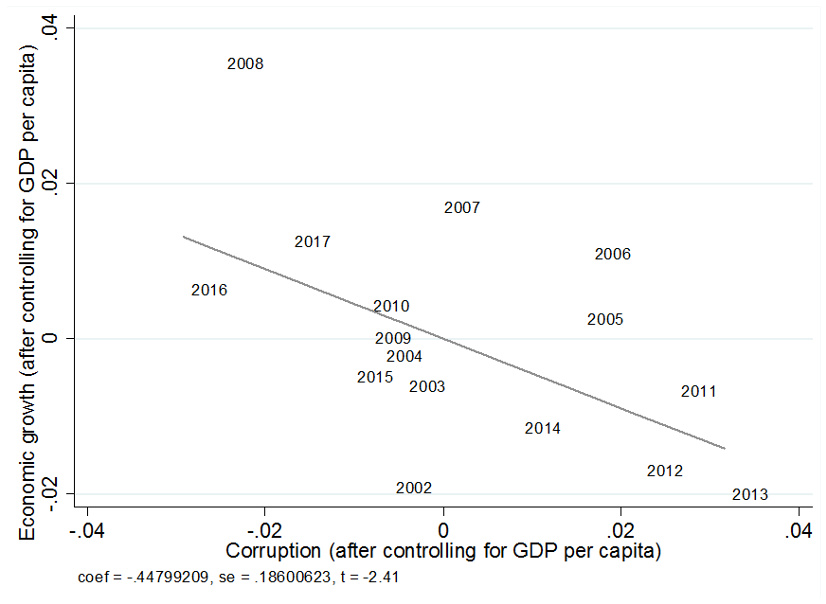
However, corruption is not only affected by the level of economic development; it also affects the dynamism of the economy. As shown in Figure 3, during 2002–17 there is a significant negative association between perceived corruption levels and the rate of GDP per capita growth in Albania, even after controlling for the level of economic development. In other words, in years when corruption was lower than predicted by the country’s level of development (less than 0 on the horizontal axis), Albania grew faster than a similar country at the same level of development but with more corruption (greater than 0 on the vertical axis). This evidence is consistent with recent findings suggesting that corruption negatively affects firm performance in Albania, reducing annual sales growth for an average firm in the industrial sector by up to 10 percentage points.7c09bf57a004
Figure 3: Corruption in Albania harms economic growth
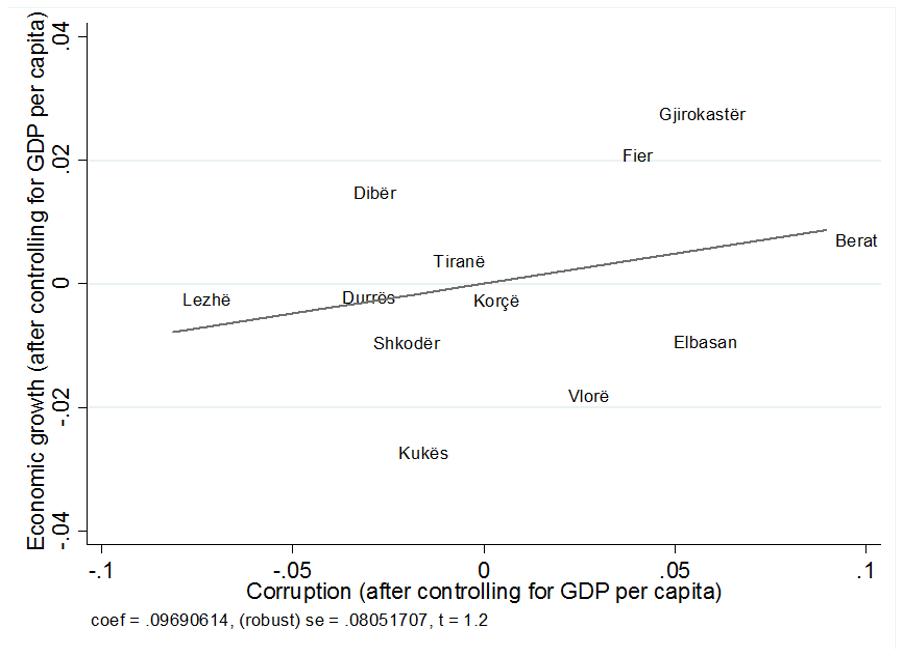
The incidence of corruption is not uniform across Albania’s regions (qarqe). Typically, regions in the country’s south report more corruption (relative to their level of development) than regions in the north (see the horizontal axis on Figure 4). Tirana sits somewhere in the middle. In addition, recent evidence suggests that, in contrast to other Balkan countries, corruption in Albania is more prevalent in rural than in urban areas.e393e366221c Interestingly, however, there is no significant association between corruption levels and economic growth at the regional (qark) level. Regions that report less corruption (relative to their level of development) do not grow any faster than regions that report more corruption (relative to their level of development). In fact, they seem to grow more slowly, although the positive relationship displayed in Figure 4 is not statistically significant. A possible interpretation of these findings is that the most corrupt regions do not bear the economic costs of their corruption, but generate negative externalities that harm the Albanian economy as a whole. Further details on the relationship between corruption and economic growth in Albania, both over time and across regions, are presented in Appendix C.
Figure 4. Corruption does not harm regional development in Albania (2010–2017)
Crucially, corruption may also be more or less widespread across different sectors of the political economy. In this paper (and on the survey questionnaire), we define sectors as ‘specific points of contact where private citizens/firms interact with the agents of the state (i.e. public officials)for a specific purpose’ and according to a ‘well-defined set of formal rules.’ The expert survey that informed this U4 Issue considered the 16 sectors listed above. Additional details about the survey methodology, which practitioners can use to design similar data collection exercises in the future, are provided in Appendix D.
For each corruption sector, the survey participants were asked to ‘estimate the probability that a given interaction [between state officials and private individuals/firms] will involve the payment of a bribe.’ The (mean) frequency of corrupt transactions (and a confidence interval of the estimate) are reported in Figure 5 for each of the 16 corruption sectors. Corruption is most frequently associated with public-private partnerships or PPPs (86%) and with public procurement contracts (75%), although the latter association is less significant.aebaed1d3e27 In 75 out of 100 interactions, private firms pay bribes in order to secure oil/mining permits; the proportion is 67 of 100 for construction permits. Tax and customs officials, health care providers, and the police, who were often perceived as highly corrupt in previous polls,f2a9876aa6c4 are now expected to accept bribe payments in only 55%, 50%, and 37% of interactions with the public, respectively. The frequency of corrupt transactions is also perceived to be relatively low in citizens’ interactions with education providers and public utilities.11d5ef0b84d8
Figure 5: Frequency of corrupt transactions in Albania by sector
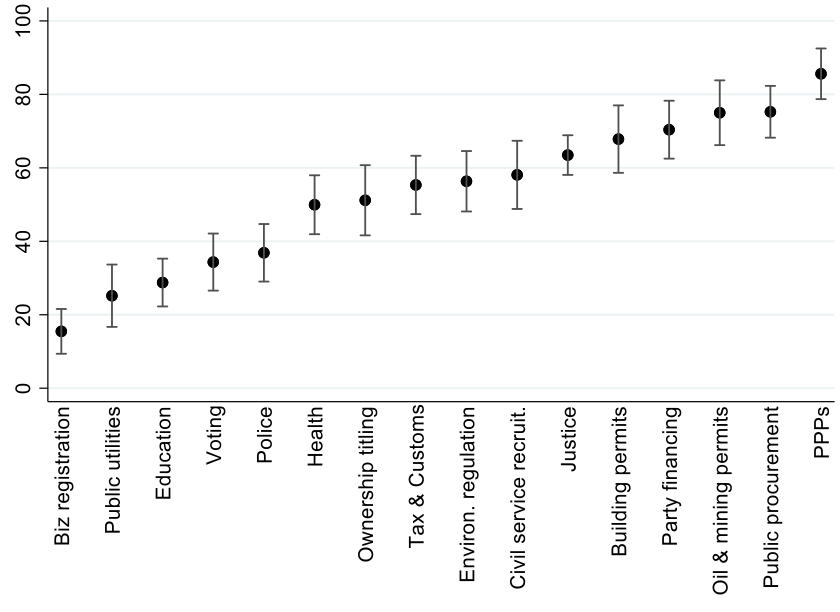
Note: The diagram reports the arithmetic means of the ratings given by the survey respondents. The error bars represent the 90% confidence interval for the means. The question is: ‘Imagine you have the power to observe all the individual interactions taking place between citizens/firms and public officials in each of the following 16 sectors. For each of them, please estimate the probability that a given interaction will involve the payment of a bribe.’ The average number of responses per sector is 22.8.
To sum up, in the last 20 years the overall prevalence of corruption in Albania has declined notably. Yet this encouraging long-term trend is more likely to be the product of structural transformations than of successful interventions by donor agencies, despite a large mobilisation of aid resources in this programme area. Anti-corruption in Albania faces daunting constraints, and donors should rethink their strategies and sharpen their tools if anti-corruption spending is to be more effective in the future. Although economic development has led to declining corruption levels, the persistence of corruption harms Albania’s aggregate economic performance. Therefore, anti-corruption is far from irrelevant from a development policy perspective. Furthermore, the fact that corruption is unevenly distributed across regions and sectors suggests that anti-corruption efforts should be better targeted.
Step 2: Prioritising feasible and impactful corruption spaces
A targeted approach to anti-corruption implies that, in the first instance, donor agencies should attack the corruption sectors with ‘the most favourable combination of impact and feasibility’.0fbbbd31a637 Let us consider each of these elements in turn.
Feasibility
While various aspects may affect the feasibility of an intervention – from donor time frames to the availability of local capacity – we relate our assessment directly to the most important element: power. For the most part, anti-corruption interventions do not fail because of resource or capacity deficits, but because of the presence of powerful groups whose interests are served by corruption. Thus, to assess the feasibility of anti-corruption efforts, practitioners should chart a society’s political power structure – what is sometimes referred to as the ‘political settlement’.6ddf33383e39 Unfortunately, governance and anti-corruption assessment often ‘remains at the superficial level of formal institutional change and fails to dig deeper into the actual links, actors and historical processes that enable [and sustain] corruption’.5e567b46762a
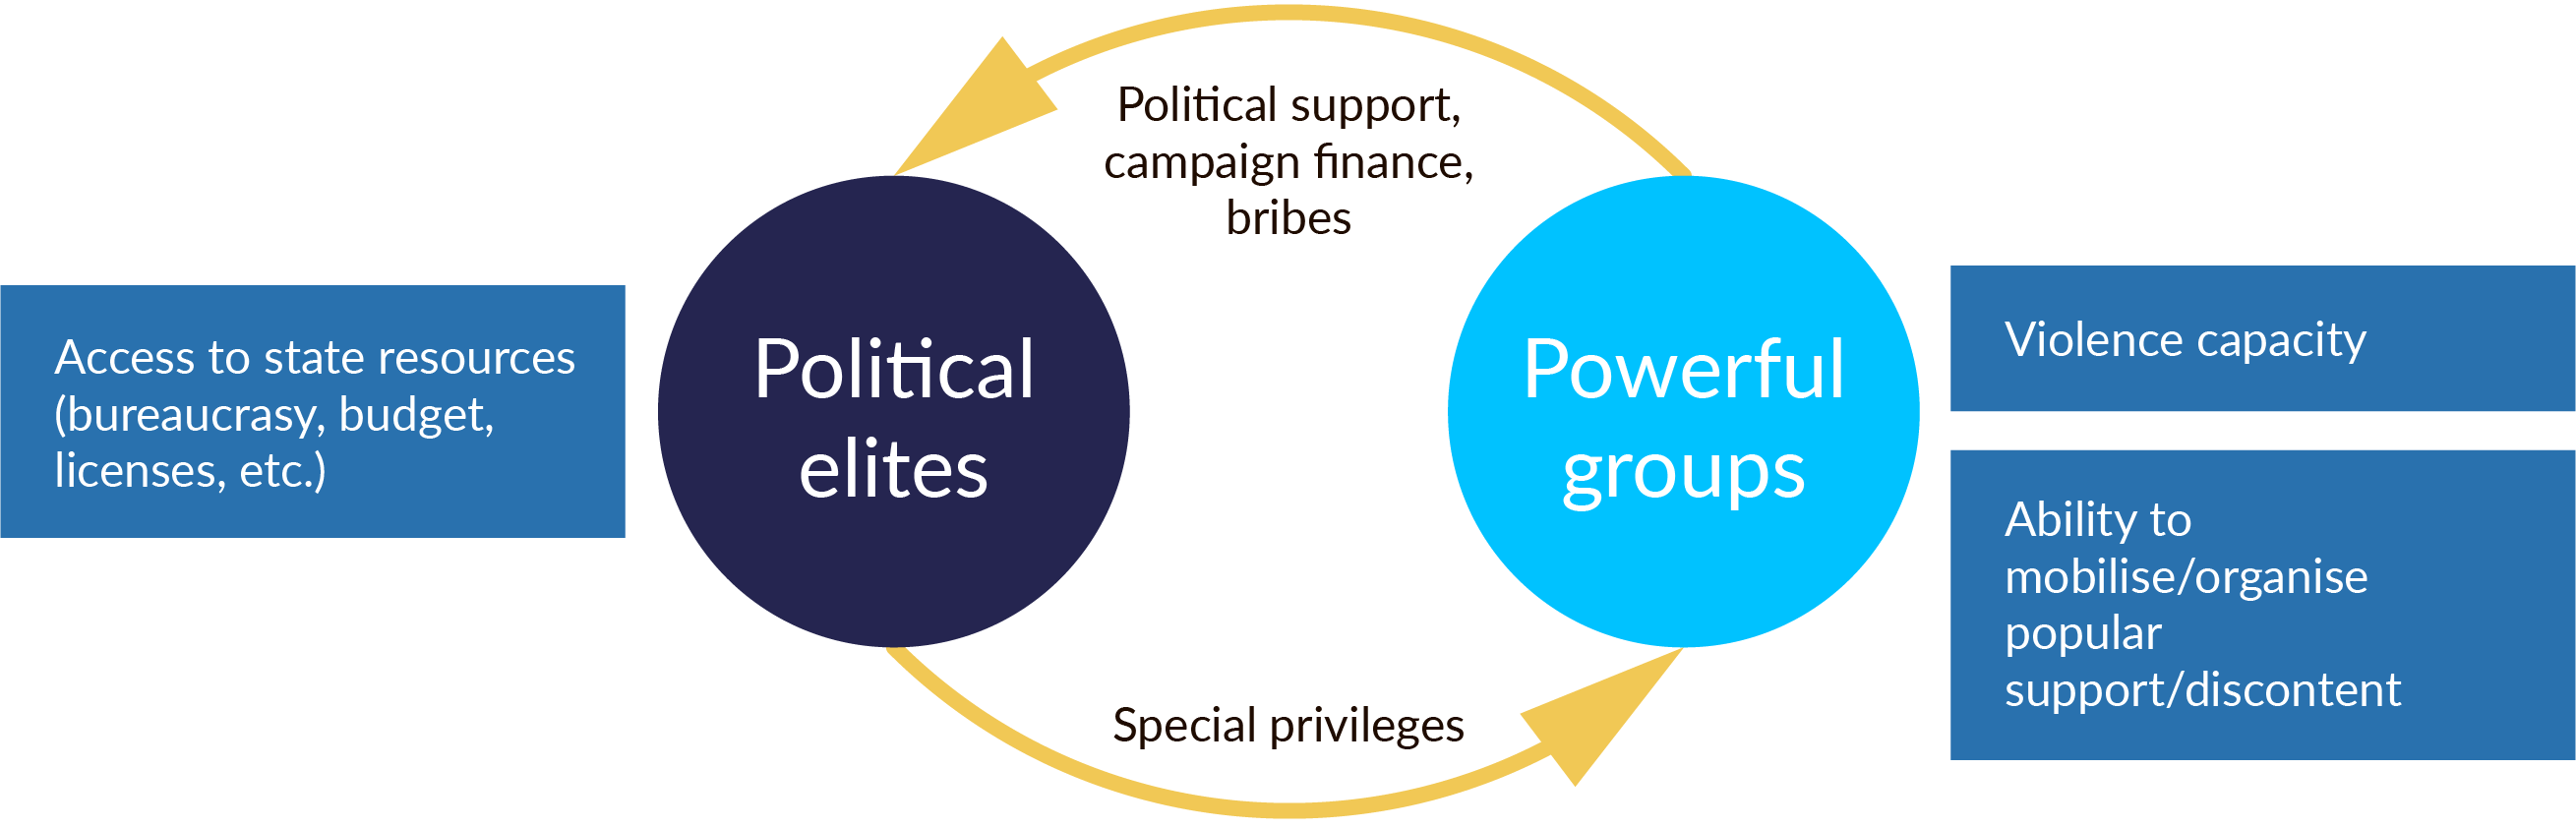
Some corruption practices serve a political stabilisation function – that is, they are used by ruling elites to accommodate and pacify powerful groups. Groups are ‘powerful’ in this sense when they can make a credible threat to mobilise (sometimes violent) support and to destabilise the political settlement if their demands are not met.448db53197db To stay in power, political elites must craft a ‘political stabilisation strategy,’ which often involves a ‘corrupt’ transfer of special benefits to powerful groups. In return, the latter provide political support and other (private) benefits to elites, making possible the elites’ political survival. Albeit corrupt, these strategies have the desirable effect of constructing and maintaining a ‘social order’ in a context where some social groups have the organisational and violence capacity to create instability.10fe8968bb7a The logic of political settlements is summarised diagrammatically in Figure 6.
Figure 6: The logic of political settlements
When selecting sectors for interventions, donors should thus carefully assess the extent to which a given corruption practice is either central or peripheral to the political stabilisation strategies used by political elites. The sectors where corruption is less important to power preservation and political stabilisation are less prone to political resistance by powerful insiders – the elites that rely on corruption to secure their political survival, and the powerful groups that seek special privileges by corrupt means. In these less politically constrained sectors, anti-corruption initiatives are more likely to succeed, and less likely to have the unintended effect of triggering political instability. To make this assessment, donors should employ political economy analysis.37ca90378252 This analysis is necessarily subject to individual judgement and should be continuously updated to track the evolution of the political settlement.
A more comprehensive account of Albania’s political settlement is presented in Appendix E. As in other countries at a comparable level of development, political parties in Albania gain and exert power largely by (a) establishing interest-based alliances with private sector firms, and (b) implementing a clientelist strategy of voter mobilisation.8a9086f90d72 Favouritism and corruption in the award of public contracts and investment licences is a crucial element of the ruling coalition’s survival strategy, as is the possibility to mobilise political activists (and, sometimes, criminal elements) in vote-buying efforts. The ruling coalition also jealously guards its political control over key appointments in the judiciary – e.g., the attorney general and the head of the (now-defunct) High Council of Justice. Under political protection, judges, prosecutors, and court employees are given carte blanche to engage in petty corruption.23c10f1fefd1 In return, judges and prosecutors offer ‘loyalty and services’ to their political patrons, including the ‘cover-up of high-level political corruption’,1eb328b46383 or they pay bribes to obtain lucrative jobs in rural areas, where the opportunity to collect bribes is greater.
Any attempt by donor agencies to use even state-of-the-art techniques to attack corruption in these key sectors – vote buying, PPPs and public procurement, the justice system – is likely to unsettle the delicate balance of Albania’s political order. Such efforts will face protracted resistance from powerful groups, expressed either as a refusal to cooperate or as more subtle forms of weakening, such as restricting the intervention’s scope or undermining the project’s implementation. Because of a likely backlash, reforms in these sectors have only limited chance of success. Even if they are successful, they may unsettle the prevailing political settlement and produce unintended consequences, such as political instability. Indeed, the ongoing implementation of the 2016 judicial reform, which was intended to weed out corruption and limit political interference in the judiciary, has been accompanied by a sharp rise in political contestation and polarisation.f603f3b4e0cb The negative economic effects of increased political instability in turn may offset the beneficial effects of reduced corruption.
Of course, all reforms are likely to meet some resistance by entrenched insiders. The point is to identify and attack a political settlement’s ‘weak points,’ where organised opposition to reform is likely to be minimal. Fortunately, some corrupt practices are more peripheral to the maintenance of a political settlement in Albania. For instance, petty corruption in the tax administration is less tied up with high-level political interests.f7dc79a375c6 Earlier surveys revealed a high incidence of corruption in the tax and, especially, customs administration.ebb560c2e4ad The current political leadership, however, has shown a determination to curb the rampant extortion previously practiced by street-level tax inspectors. Therefore, this corruption sector may offer a window of opportunity for additional interventions.
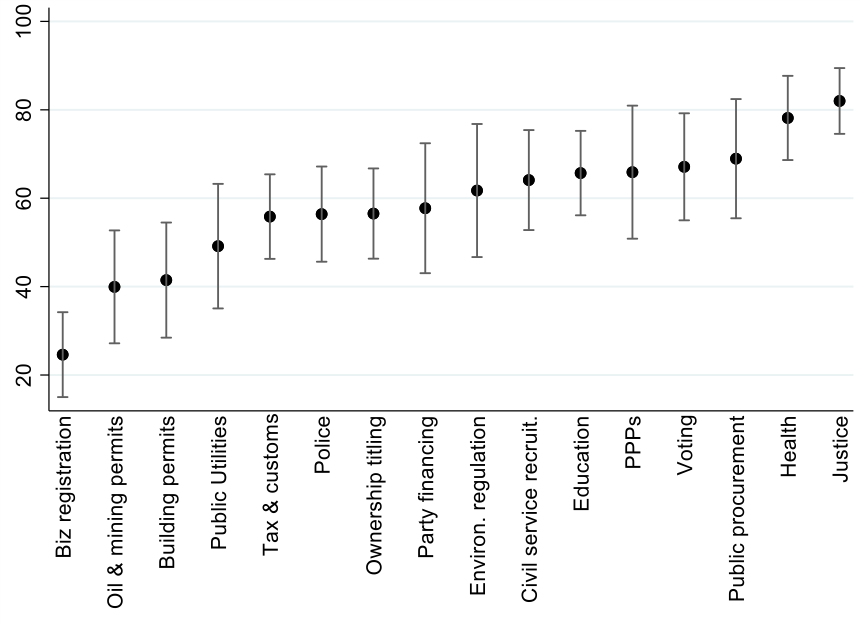
To systematise and extend the political economy analysis, donors should rank corruption sectors in terms of how amenable they are to external interventions – that is, how feasible interventions are likely to be in each sector, given the prevailing distribution and forms of political power in the target country. One way to do this is to run a poll of experts. Towards this end, our survey asked respondents to rate ‘the probability that powerful individuals/organisations may successfully resist or distort an (otherwise well-designed and adequately resourced) anti-corruption intervention to the point that the intervention may fail to substantially reduce corruption.’ A low probability of failure suggests that the intervention is feasible. The feasibility ratings are presented in Figure 7, where the vertical axis shows the estimated probability of success of an anti-corruption intervention.cd52d9ad59ab Among the sectors that are believed to be most amenable to anti-corruption interventions are education, public utilities, and health and environmental regulation. Public procurement and PPPs, by contrast, are among the sectors where anti-corruption interventions are most likely to face resistance by powerful groups.
Figure 7: Estimated feasibility of anti-corruption interventions in Albania, by sector
Note: The diagram reports the arithmetic means of the (inverse) ratings given by the survey respondents. The error bars represent the 90% confidence interval for the means. A higher number denotes higher feasibility.
Impact
In Albania, the overall prevalence of corruption is negatively associated with aggregate economic performance. Yet some forms of corruption may be more damaging than others, driving this correlation. It therefore makes sense to attack these forms of corruption first, feasibility permitting, rather than spread ‘anti-corruption dollars’ more thinly across many different corruption sectors. To maximise the developmental effectiveness of anti-corruption aid, donors should estimate the relative impact of different corruption practices and channel resources to the sectors in which corruption has the largest negative impact on development. Doing so would allow donors to maximise the beneficial impact of aid spending.
To assess the relative impact of different corruption practices, donors should investigate the socioeconomic effects of corruption. Typically, bribe-paying firms (or citizens) enter into corrupt transactions in order to obtain special privileges, which economists sometimes refer to as ‘rents.’ These privileges may be government goods, such as licences, that should otherwise be allocated based on impersonal criteria. Alternatively, special privileges may take the form of forbearance, waivers of costly rules such as taxes or fire regulations that the bribe recipient – typically, a public official – has the power to impose or enforce. Recent perspectives suggest that the most consequential aspect of corruption is not the monetary value of the bribe itself, but the productivity or welfare effect on society of the special privileges created and allocated by bribe-receiving officials.6b13ba901238 In most cases, special privileges are productivity- and welfare-reducing, although there are also situations where they may be justifiable on economic grounds. Thus the most impactful anti-corruption reforms are those that target the corrupt practices that either create and sustain damaging special privileges or subvert the allocation of socially useful special privileges (to the extent that these exist).
Estimating the relative impact of different corrupt practices is not easy. Donors should employ a combination of qualitative and, where possible, quantitative analysis. In Albania, special privileges are not created and allocated by the ruling coalition as part of a comprehensive economic policy strategy. Typically, such privileges are just a means used by the ruling coalition to appease powerful groups and ensure political stability.6d4702b322d9 In general, therefore, special privileges do not promote capital and technology accumulation in the real economy. PPPs, for instance, have been used to execute urban renewal projects with a questionable economic logic. Job patronage in the public administration, which is rampant, can lead to a bloated and/or fragmented public bureaucracy, thereby weakening state capacity. The corrupt distribution of building permits imparts an artificial stimulus to the construction sector, leading to job creation and votes, but also to market imbalances and oversupply in Tirana’s housing market.4fbf709df5ffc13c8af3a786
Yet some corruption practices may generate special privileges that are not necessarily wasteful or distortive. In Albania, the health care sector offers a possible example. Here, corruption takes the form of informal payments to doctors (and other health care personnel) to obtain better or quicker treatment. In this case, the special privilege – the right to skip the queue or to receive higher-quality care – may not necessarily be welfare-reducing. Given a limited availability of public funding for health care, corruption may facilitate the operation of an informal ‘market’ for health care services, leading to a more efficient allocation of medical resources. In this (somewhat stylised) ‘market,’ the patients who are willing to pay a higher price – those in greater need – are served earlier and better, ensuring that those who can derive the most benefit from a (scarce) bundle of resources are prioritised in the allocation process. If this is the case in Albania, donors wishing to maximise the economic impact of anti-corruption dollars should consider prioritising interventions in the PPP, construction licensing, or other sectors, rather than in health care, although considerations of feasibility should also be factored in.
To organise and consolidate a range of informed views about the impact of corruption in Albania, we used expert polling. In our survey, a distinction was made between the social and economic consequences of corruption. As a proxy for social impact, the respondents were asked to ‘estimate the share of the Albanian resident population that is regularly affected’ by corruption in a given sector.8831019bf142 The estimates, by sector, are reported in Figure 8. Corruption in the justice and health care systems are believed to have the largest negative social impact, with around 80% of the Albanian resident population affected by them. Anti-corruption interventions in these sectors, if successful, may be expected to be highly impactful, as they would free a large section of the Albanian population from corruption. Corruption in the licensing of oil, mining, and construction activities, as well as irregularities in the award of PPPs and election campaign finance,59c1caca6fcb are believed to affect a significantly smaller share of the Albanian population.
Figure 8: Estimated impact of corruption on society in Albania, by sector: Share of population affected
Note: The diagram reports the arithmetic means of the ratings given by the survey respondents. The error bars represent the 90% confidence interval for the means.The average number of responses is 18.9.
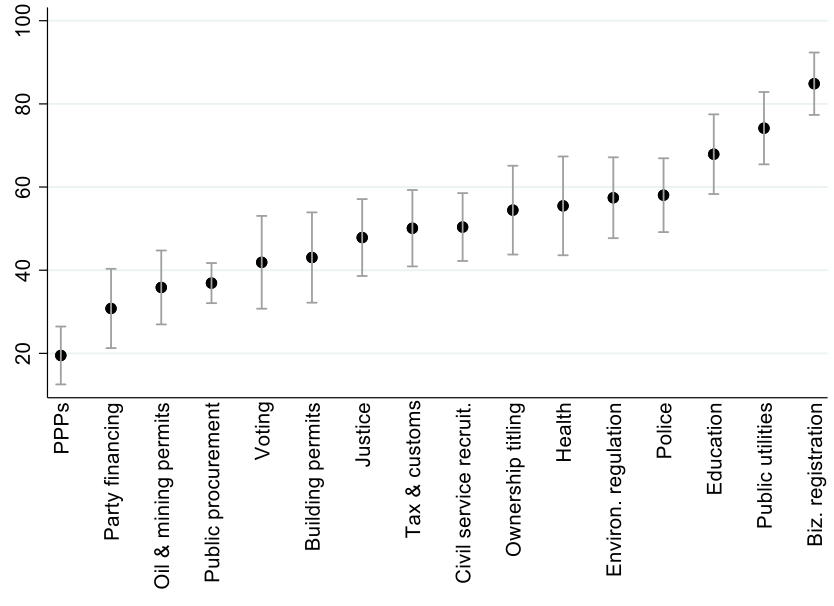
Of course, corruption may generate large economic and welfare losses, even if relatively few individuals are directly involved in the corrupt exchanges. To examine this possibility, the survey also asked the respondents to rank the 16 corruption sectors ‘in terms of how much of an obstacle [they present] for economic development (GDP growth) in Albania.’ The respondents were told that ‘ranking [sector X] above [sector Y] implies that eliminating corruption in X would boost economic growth more than if corruption was eliminated in Y.’ The responses are presented in Table 2, where a higher number denotes a more detrimental impact of corruption.
Table 2: Estimated impact of corruption on economic development in Albania, by sector
| Sector | Sum of ranks |
| Justice | 313 |
| PPPs | 251 |
| Public procurement | 250 |
| Civil service recruit. | 209 |
| Party financing | 199 |
| Tax & customs | 198 |
| Ownership titling | 192 |
| Voting | 172 |
| Police | 171 |
| Oil & mining permits |
168 |
| Education |
167 |
| Building permits |
162 |
| Health |
158 |
| Environ. regulation |
145 |
| Public utilities |
108 |
| Biz. registration |
76 |
Note: A higher number indicates more damaging impact. To aggregate the responses, we inverted the rankings, so that a higher ordinal rank indicates higher impact. Then, for each sector, we summed the ranks given by the respondents.
According to the survey respondents, the economic and social consequences of corruption are highly correlated: the forms of corruption that are damaging to the economy are also damaging to people (Figure 9). The correlation, however, is not perfect. Some forms of corruption (e.g., in health care) affect the population much more than they harm economic development. For others (e.g., in the licensing of mining and construction activities), the negative impact on economic performance is more pronounced.
Figure 9: Economic vs. social impact of corruption in Albania, by sector
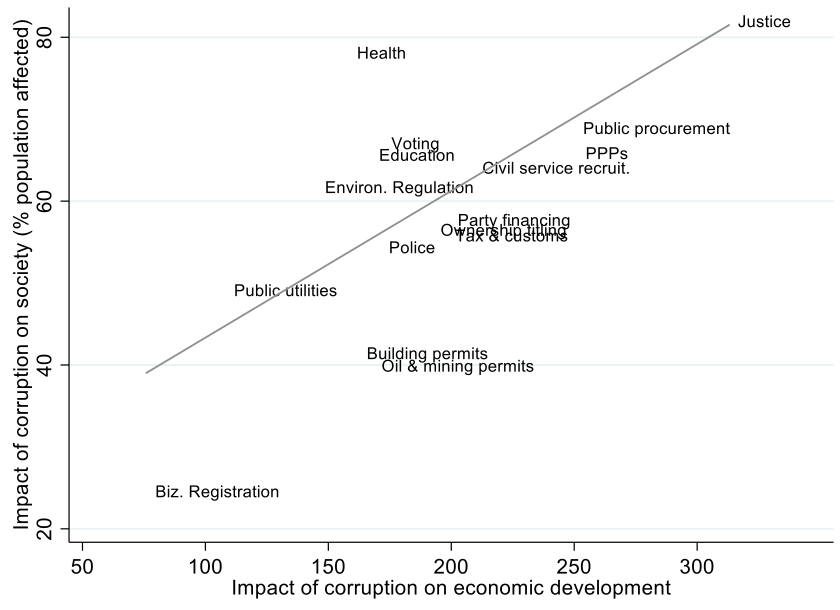
Note: The correlation coefficient is 0.69 (p-value = 0.003).
An ideal, first-best intervention would be both feasible and high-impact. Yet it may not always be feasible to implement the most impactful interventions; similarly, the most feasible interventions may have only a marginal impact on development. When programming anti-corruption interventions, therefore, donors are often called to make second-best choices. A useful tool to evaluate the trade-off between impact and feasibility is a diagram that plots the relationship between these two elements. Figure 10 considers impact in terms of economic growth, while Figure 11 considers impact in terms of the share of population affected. In both diagrams, the best candidates for intervention are located in the top-right quadrant: here, anti-corruption interventions are expected to be both high-impact (because the corruption they attack is very damaging) and feasible to implement (because they are less likely to run up against structural constraints or political resistance).
Figure 10: Impact-feasibility diagram: Economic impact
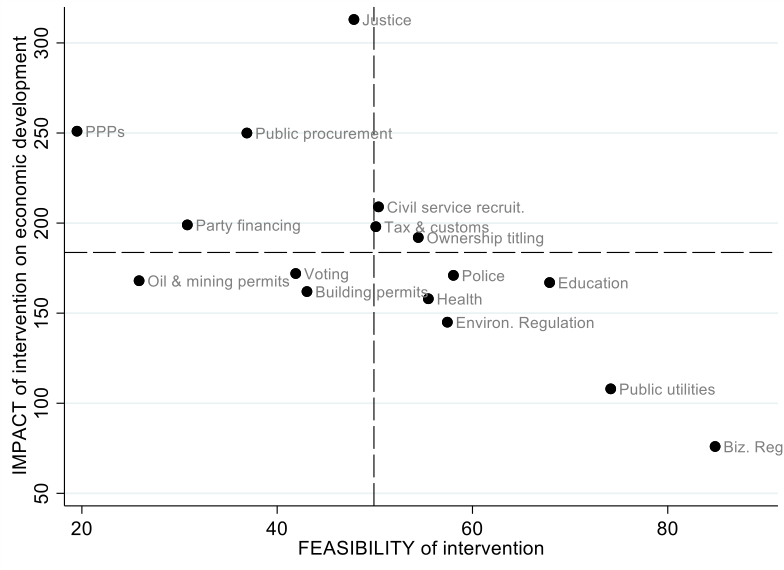
Note: The correlation coefficient is −0.63 (p-value = 0.008). The feasibility of intervention is measured by the intervention’s estimated probability of success, while impact is defined as in Table 2.
Figure 11: Impact-feasibility diagram: Social impact
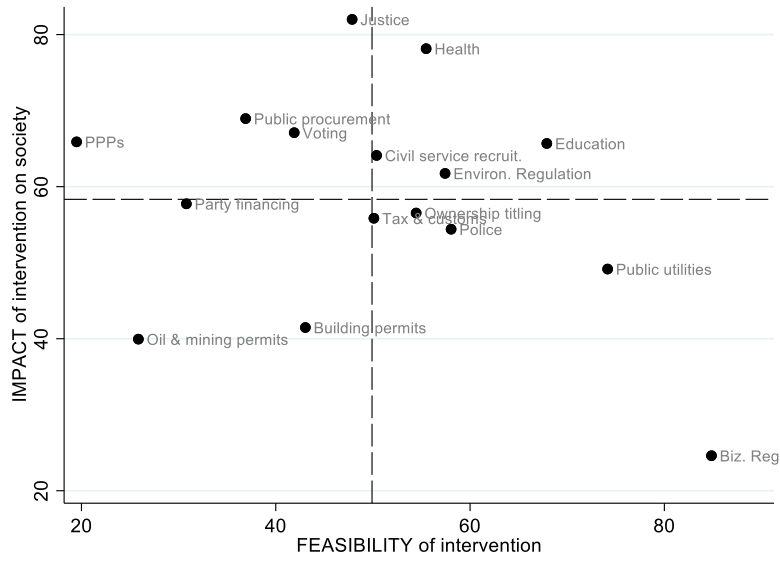
Note: The correlation coefficient is −0.29 (p-value = 0.277). The feasibility of intervention is measured by the intervention’s estimated probability of success, while impact is defined as the share of the Albanian resident population affected by the corruption being targeted.
As shown in Figure 10, the survey respondents believe that economic impact and feasibility are inversely and significantly related. Somewhat discouragingly, the sectors where anti-corruption efforts would be most urgent and impactful (PPPs, public procurement) are also the ones where donors are most likely to encounter stiff political resistance. When impact is conceptualised in terms of number of people affected rather than economic growth, however, the inverse relationship observed in Figure 10 becomes much weaker and loses statistical significance, revealing at least two sectors with a favourable combination of impact and feasibility: health care and education (Figure 11). According to the survey participants, anti-corruption interventions in the education sector have a 68% chance of success and would positively impact some 66% of the Albanian resident population. The steps that donors should follow to select and prioritise corruption sectors, and allocate anti-corruption aid ‘smartly,’ are summarised in Checklist 2.
Checklist 2: Prioritise promising sectors for intervention
- Unpack corruption: classify different corrupt practices in terms of sectors, based on the local context.
- Use qualitative and quantitative analysis to identify corruption sectors that are peripheral to the prevailing political settlement and thus amenable to external interventions in the short run.
- Rank corruption sectors in terms of their relative impact on various dimensions of development.
- Use scatter plots or cross-tabulations to identify the corruption sectors that are (a) highly detrimental to development, and (b) not very politically entrenched, and hence amenable to external interventions.
- Target interventions to those sectors.
Lastly, the survey respondents believe that the most damaging forms of corruption are those characterised by grand corruption. At the same time, they pointed out that the sectors more easily tackled by anti-corruption initiatives are those affected by petty corruption – arguably because those sectors are less likely to be controlled or influenced by high-level political or criminal structures. Additional findings are presented in Appendix F.
Step 3: Identifying and evaluating corrupt practices in specific corruption spaces
Within a given corruption space or sector, different types of corrupt practices may coexist. Having pinpointed a ‘smart’ sector for intervention, practitioners should then identify and evaluate the constellation of (typically interlinked) corrupt practices that collectively make up the sector. In addition, practitioners should focus on the actors involved in, and driving, these practices, reflecting critically on their interests and power – whether they gain or lose from the corruption, and whether they could be enlisted as drivers of change. These steps are summarised in Checklist 3 and illustrated with reference to Albania’s education sector, which offers the most favourable combination of impact and feasibility among the country’s corruption sectors. In particular, we focus primarily on the higher (tertiary) education sector.
Checklist 3: Identify and evaluate corrupt practices in a sector
- Use your local knowledge, critical judgement, and imagination to identify different corrupt practices in the sector of interest.
- Assess the relative feasibility of tackling each of these practices: estimate how important each practice is to the maintenance of power by influential actors in the sector.
- Assess relative impact: estimate the economic and social damage caused by each practice.
- Plot an impact-feasibility diagram.
- List the main actors involved in this sector.
- Analyse the interests of the actors in terms of who benefits, and who loses, from each corrupt practice; this will indicate who has an interest in its perpetuation and who has an interest in its termination.
- Analyse the relative power of the actors: assess which actors would in principle have the power, influence, and legitimacy to trigger and sustain a momentum for change.
- Plot the actors on a power-interest matrix to identify actors with the power and motivation to drive change.
When surveying a sector’s corrupt practices, one should ask, first, what are the features of the institutional environment that make corruption possible (a ‘how’ question); and second, what are the individual reasons that motivate bribe payers to pay bribes (a ‘why’ question).12a16e35c1b6
In Albania, while university admissions are likely to be relatively free from corruption, university professors often demand or accept bribes in exchange for passing students or giving them good grades. Since the fall of the communist regime in 1991, ‘gifts […] such as free lunches or dinners have become less important in gaining an advantage in education [relative to the communist period]’; in their stead, monetary bribes have […] become [the] key instrument of corruption’.6e6f73d0a0a8 This corruption is market-like: anyone can purchase grades at the going rate. At the same time, however, kinship ties to professors and other informal networks are also instrumental to gaining preferential treatment in the classroom. Here, corruption is rooted in social norms and alternative moralities. In both cases, the opportunity to solicit and collect bribes is closely linked to the fact that academic appointments and promotions are already beset by nepotism (‘how’). The motivation to pay bribes, in turn, whether in cash or in the form of gifts, is likely to originate in a combination of social norms of reciprocity and personal interest (‘why’).
The accreditation of education providers and degree programmes is less likely to be affected by corruption, not least because the accreditation process mandates that each degree programme should be reviewed by at least one international referee (out of two). The rules governing the distribution of research funds to universities and research institutes, however, remain opaque.4bd81b40f08e842a5c7e4f29
Next, practitioners should evaluate the degree to which each of these practices is peripheral to elite interests (and hence feasible to attack), and also damaging from the point of view of development (and hence likely to lead to high-impact interventions). Much like the sectors themselves, corrupt practices within sectors can be plotted on the impact-feasibility plane, as in Figure 12. The positioning of these corrupt practices on the diagram reflects the authors’ fieldwork interviews and knowledge of the local context.
In Albania, corruption (e.g., nepotism) in academic appointments and promotions is likely to be more harmful than petty corruption in the award of exam grades (see vertical axis in Figure 12). Studies have shown that the propensity to pay or accept bribes (at the individual or country level) is inversely related to measures of intellectual ability, possibly because intellectual ability gives individuals a longer time horizon.a061349b691a Thus, corrupt appointments and promotions can usher less capable individuals into faculty positions and push down the quality of teaching – an outcome that would affect all students, whether or not they pay bribes.
Corrupt academic promotions, furthermore, may be even more damaging than corrupt entry-level appointments. If senior academics with substantial decision-making power (e.g., heads of department) are corrupt, and hence less capable, they may lower the overall quality of education provision in a department. Thus, on the impact metric, anti-corruption interventions should prioritise academic promotions over appointments, at least in the first instance. By forging a highly capable cadre of senior professors, university departments might succeed in reducing the incidence of corruption at the top. This may also have a positive trickle-down effect down the hierarchy, while ensuring that important academic decisions are taken by honest and capable senior professors.
Figure 12: Corrupt practices in Albania’s education sector: Impact-feasibility diagram
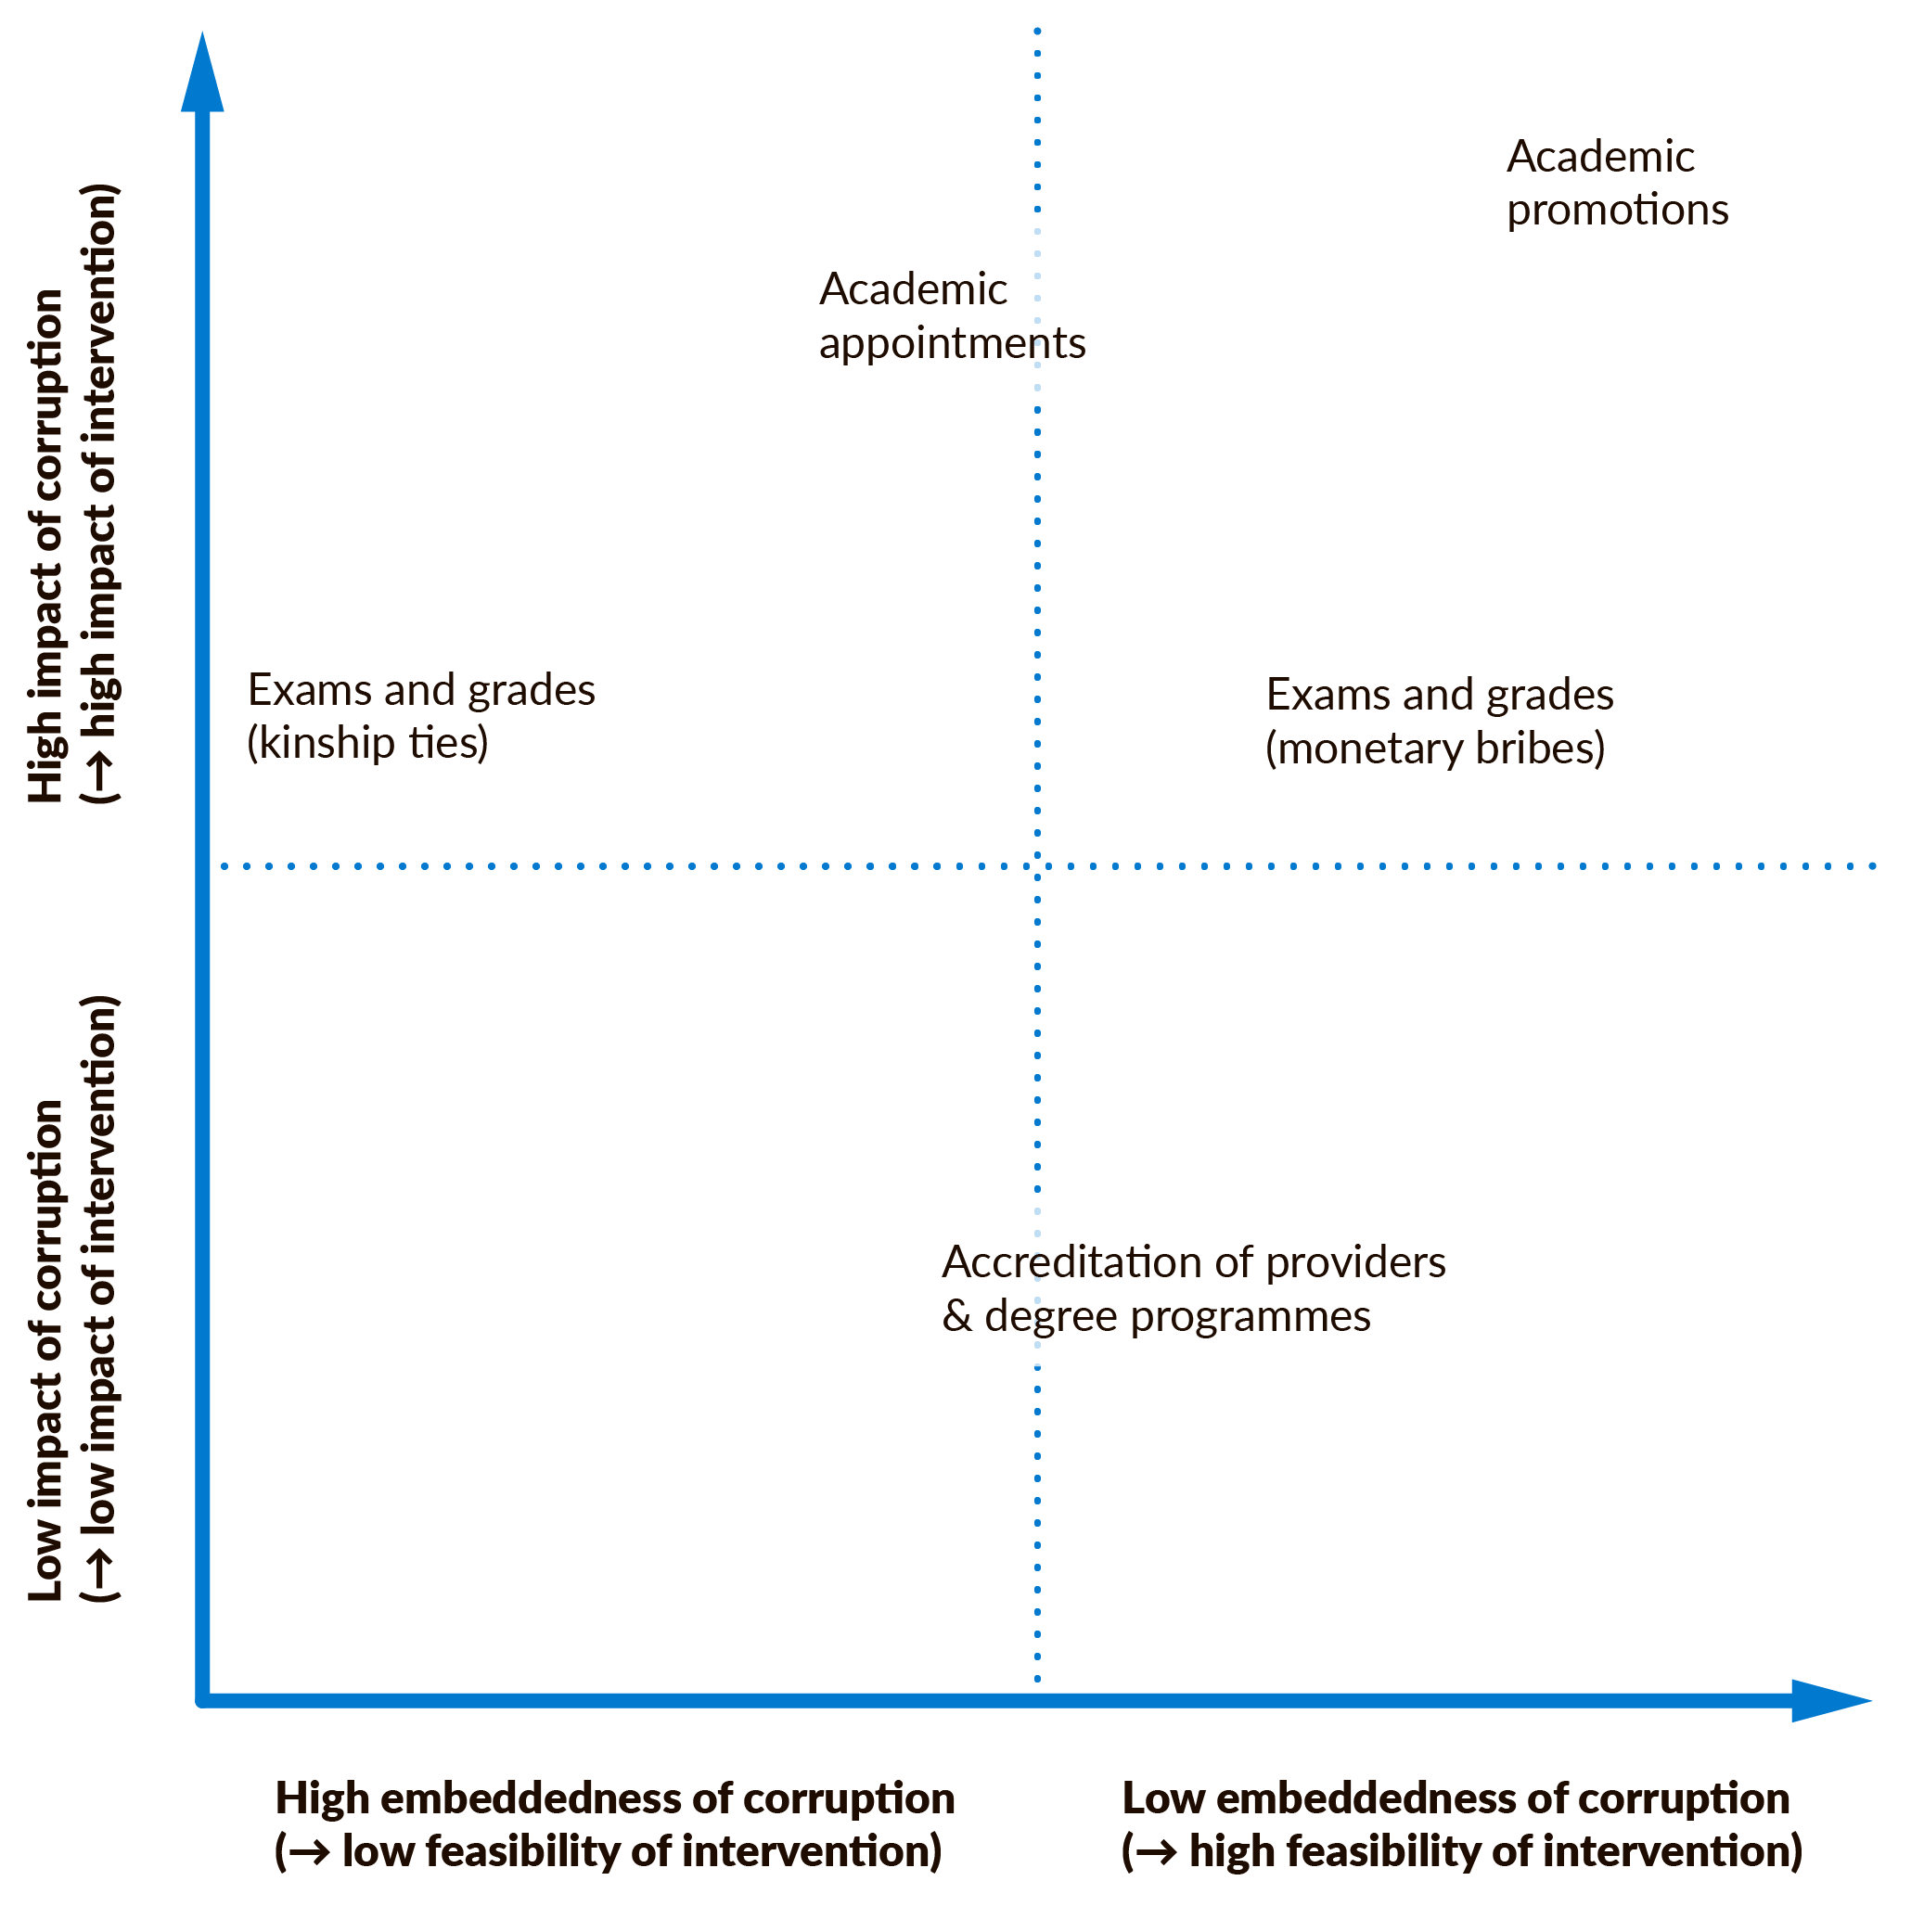
On the feasibility metric (horizontal axis in Figure 12), tackling academic promotions is also likely to score much better than tackling academic appointments. Based on deep-seated cultural norms of reciprocity, some nepotistic pressures may be too strong to resist completely, making it difficult to weed out all non-meritocratic appointments in the short run. Developing tools to ensure that corrupt appointees do not make it up the hierarchy to positions of authority (while maintaining a ‘vent’ for nepotistic pressures in less critical areas) would be the second-best choice given the set of existing constraints. A reduction in the number of promotions would also cut costs, potentially securing the crucial support of university managers and politicians.
Now consider petty corruption in the award of exam grades. Here, weeding out corruption in pursuit of monetary gain is likely to be more feasible than attacking favouritism that is based on kinship ties. Professors who accept bribes to serve their own self-interest are more likely to be responsive to incentives (e.g., the threat of punishment) intended to alter their cost-benefit calculations: those who award grades as a favour based on a culturally rooted sense of obligation are less likely to be dissuaded by potential rewards for good behaviour and penalties for malfeasance.
Next, practitioners should identify the main actors that compose the sector of interest (here, higher education) and plot them on a power-interest matrix (Figure 13), highlighting the extent to which the actors have the power and an interest to drive or demand change. In Albania’s education sector, the relevant actors are the Ministry of Education, regulatory and auditing bodies, state and private schools and universities, teachers and professors, students, and parents. The regulatory agencies whose mandate extends to the education sector include the Quality Assurance Agency in Higher Education (ASCAL),96af6a6e2d57 which is responsible for accreditations and quality control; the Education Services Centre (QShA),b3e80f5865c7 which sets, administers, and certifies state examinations; and the National Agency for Scientific Research and Innovation (AKKShI),c8d152f3d056 which awards research grants to universities and research institutes. Access to higher education increased rapidly after 2004, as new private providers were allowed to enter the market; this pushed the gross enrolment rate to 75% by 2015, up from 15% in the 1990s.21eef3333ec8 Thus, although 83% of the country’s 150,000 students go to public universities, as many as 26 of Albania’s 41 universities are private,1d79b0646d03 giving rise to a powerful constituency of education sector entrepreneurs.
Figure 13: Actors in Albania’s education sector: Power-interest matrix
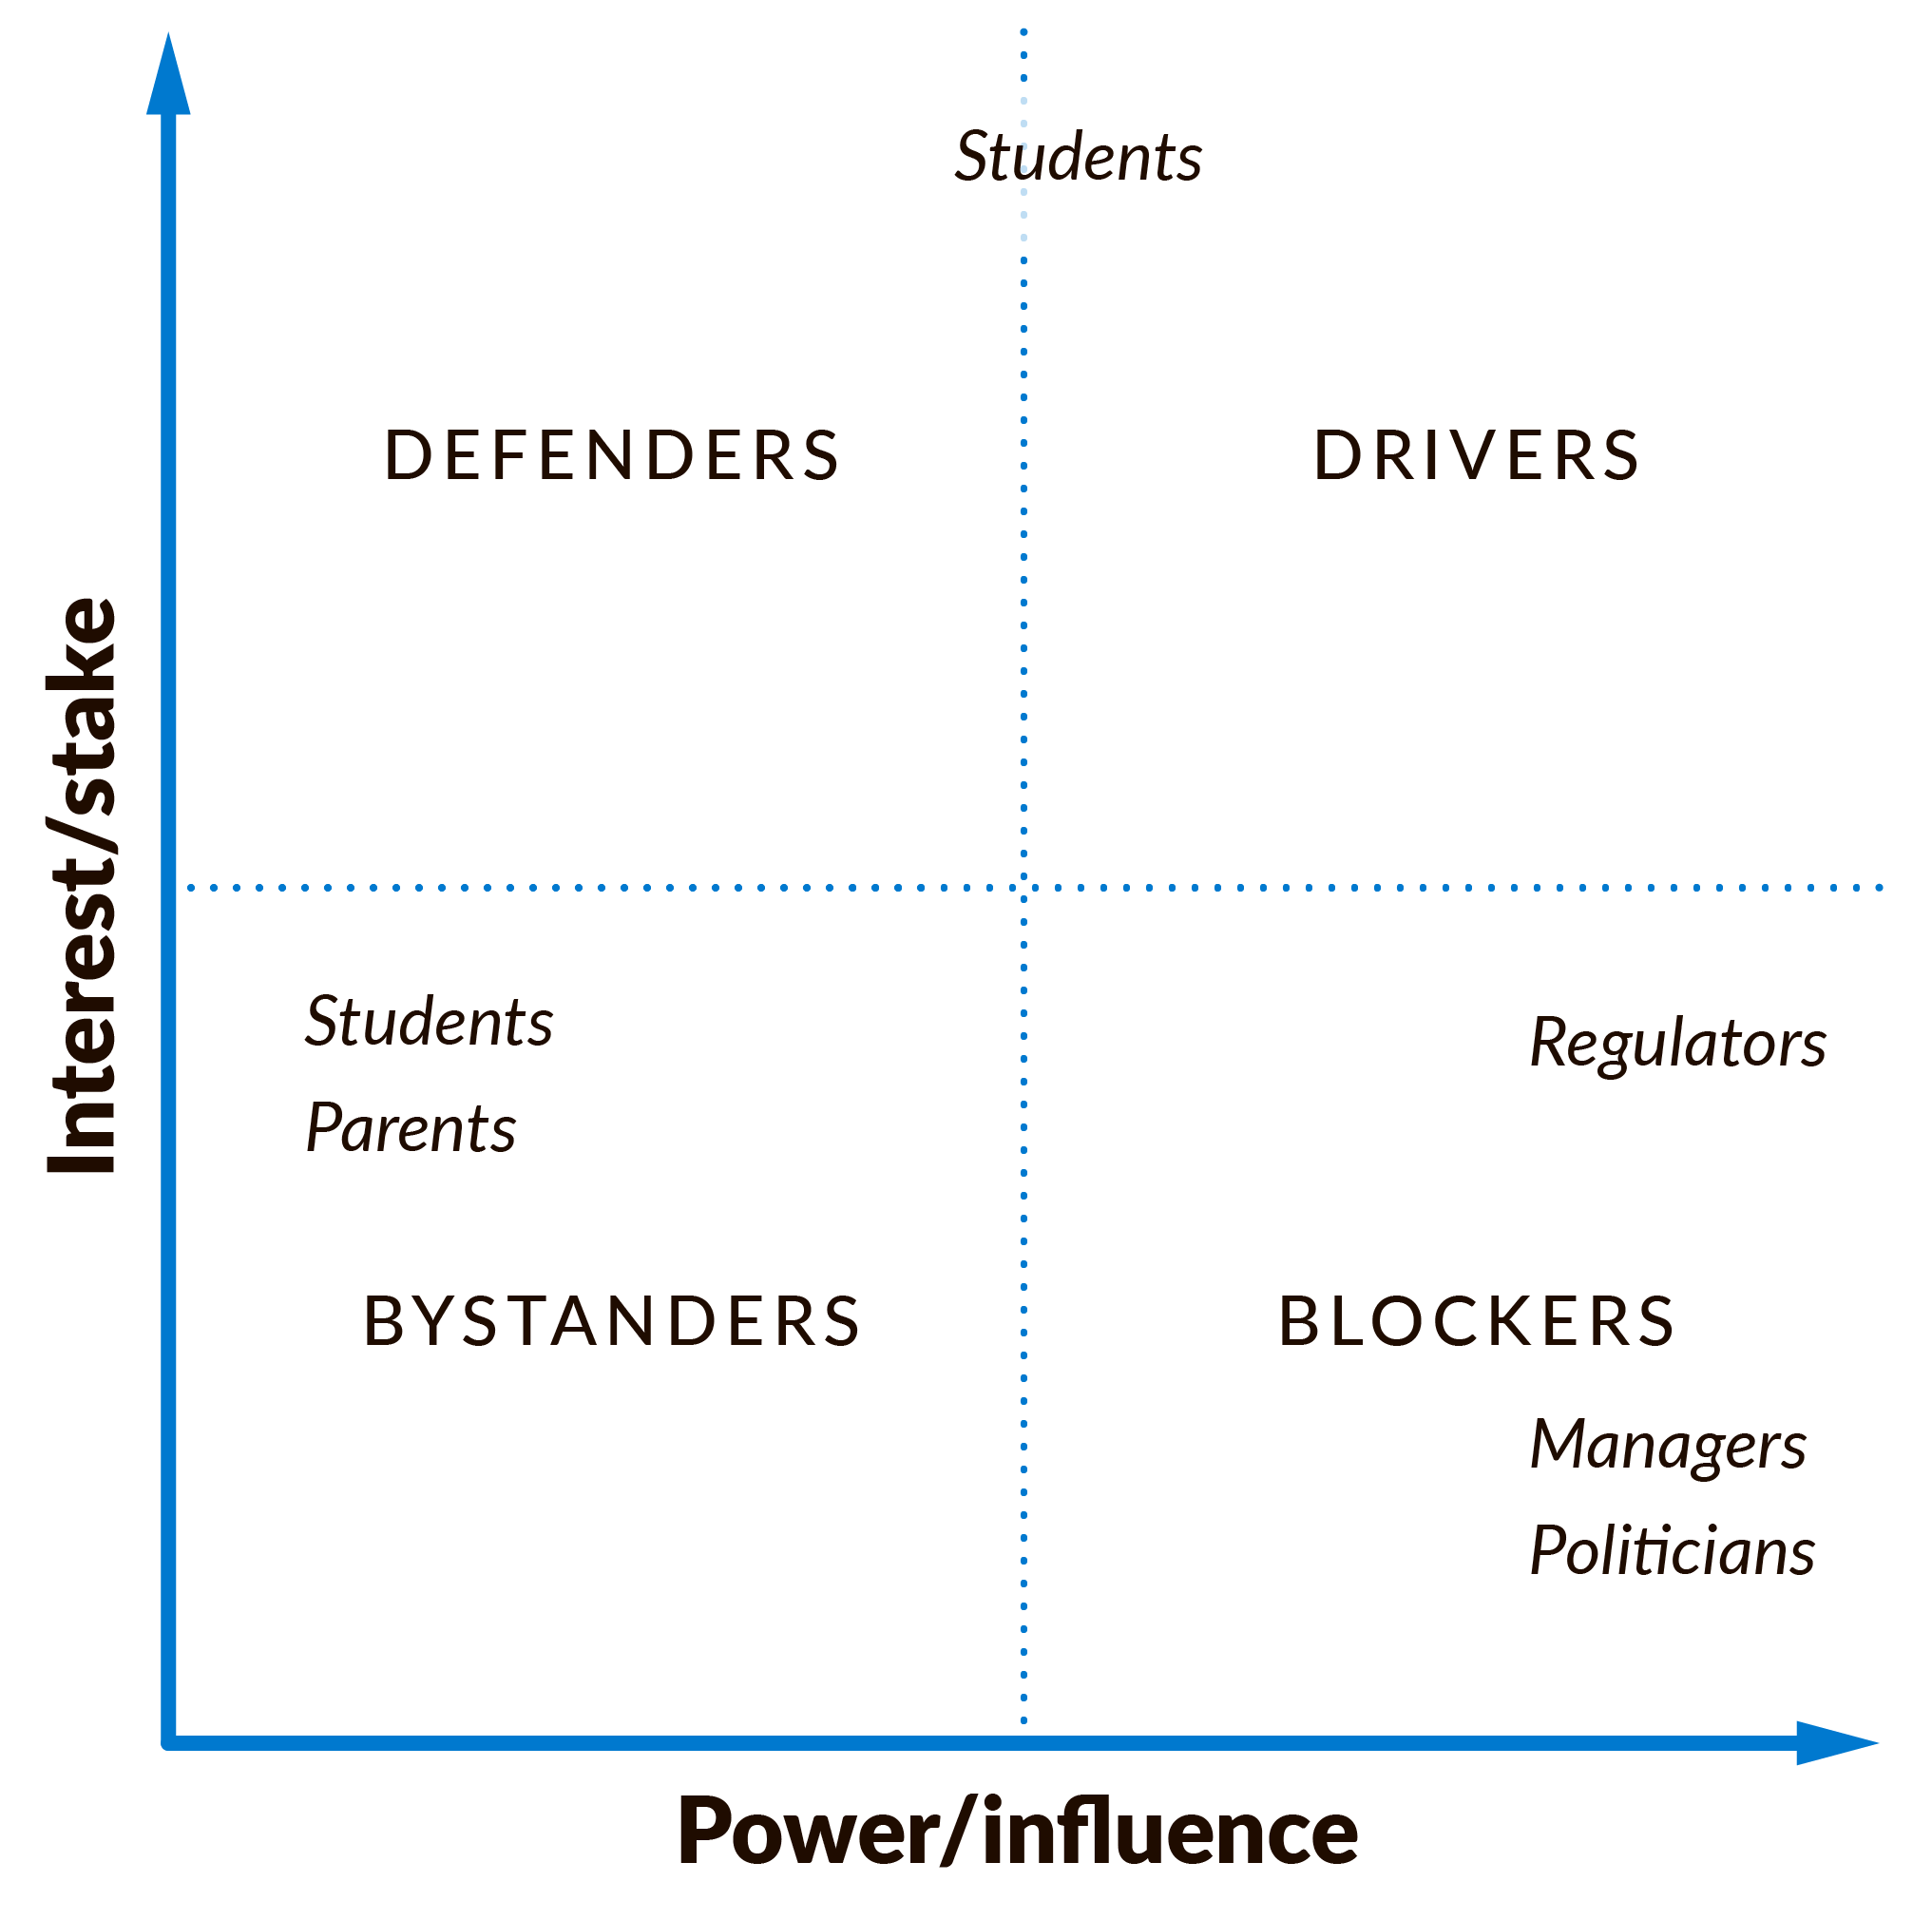
Students and parents are often powerless as professors extort money for awarding good grades. Some of them (especially poorly performing students) might even have an interest in seeing such corruption continue, as it allows them to pay their way around exams and reduce the level of learning effort required. Thus, many students can be little more than bystanders in the process of change. Yet since the December 2018 student protests in Albania, some university students have shown their potential to act as drivers of change. By articulating a clear political message, the student movement has gained traction and legitimacy, commanding the attention and support of the broader public. The movement’s leaders have also successfully resisted attempts by party structures to co-opt and incorporate the movement. The concessions extracted by the protestors (a leadership reshuffle in the Ministry of Education, a roll-back of a proposed student fee hike) speak to the power and influence that the student movement has accumulated in recent months.1f784fd75c9d Since the student movement has yet to prove its ability to drive change in the medium or long term, it is probably best classified as in between a driver and a defender. In contrast, university managers (some of whom are government appointees) and politicians may have a stake in the status quo: some state universities are used as grounds for political recruitment, while some private providers are owned by influential political and business figures. Since they are likely to be powerful as well as averse to change, managers and politicians may well be blockers in the process of reform. Anti-corruption practitioners should thus consider partnering with the organised student movement, enlisting it as a lever of change.
Step 4: Chart the state of play of anti-corruption within sectors
The next step is to look at the broader institutional and policy context within which the corrupt practices identified take place. So far, we have assessed corrupt practices and actors from the impact/feasibility and power/interest perspectives. We now turn to examining how policy inputs may have brought about or modified the patterns of corruption identified. Some of the research questions that should guide the analysis are presented in Checklist 4.
In Albania, donor agencies have never targeted education-specific corruption through a dedicated aid-funded project.a51acb12ea95 Even so, the education sector has experienced a dramatic overhaul since the 2013 elections brought a new government to power. In 2014, the introduction of a new university accreditation system, based on the British model, led to the closure of a large number of low-quality private providers, many of which may have obtained accreditation by corrupt means.55018ed5e9fd The success of this reform suggests that (a) university owners did not have enough lobbying (or bribing) power to induce the ruling coalition to delay or water down the reform; and (b) the current ruling coalition is much less willing than its predecessors to use private university licences, or the education sector more broadly, as a tool of political accommodation and stabilisation. Donors should consider taking advantage of this window of opportunity to further push the reform agenda in this critical sector.
Checklist 4: Chart the state of play in a sector
- What were the most consequential reforms (legal and institutional) that have taken place in the [education] sector in recent years?
- How did these reforms affect the level of corruption in the [education] sector, if at all? Did corruption increase or decrease as a result of them?
- Was the [education] sector ever the target of anti-corruption interventions by the government or the donor community? If so, were any of these interventions successful?
An important recent development is the introduction of a GPA (grade point average) system for admission into tertiary education. On the other hand, this new system may disadvantage low-performing students, many of whom come from low-income backgrounds. This newly created barrier may increase incentives for secondary students, or their parents, to resort to bribery as a strategy to obtain the necessary grades to secure admission to tertiary education. That said, education in Albania is no longer the fierce political battleground it used to be in the 1990s and early 2000s, when personnel and textbooks were systematically subject to the vagaries of political alternation.a37ae56f11a7
Step 5: Develop an action plan
Having gone through these steps, practitioners are now better placed to articulate a comprehensive action plan targeting the corruption sector of interest – here, education. Such a plan should involve a multi-pronged, tailored approach that addresses the underlying causes of corruption. To this end, practitioners should first formulate a set of objectives, each corresponding to a corrupt practice that scores favourably on the impact-feasibility matrix. The formulation of the objectives should explicitly identify the target actors, who should also score favourably on the power-interest matrix. Next, practitioners should imaginatively select potential interventions that are likely to achieve the objectives they have set. Appendix G presents a menu of potential anti-corruption tools and interventions that practitioners can draw inspiration from during programming.
An illustrative action plan designed to fight education-specific corruption in Albania is presented in Table 3. In light of Figure 12, this action plan targets two corrupt practices that are likely to be relatively responsive to external interventions, while also having a high negative impact on the education sector: (1) monetary corruption in the award of exam grades, and (2) unmeritocratic academic promotions. In addition, the plan seeks to mobilise two sets of actors that have both an interest in change and the power and influence to potentially push for change – namely, professors and the student movement.
Table 3: Action plan for fighting education-specific corruption in Albania
| Corrupt practice | Objective | Actions/interventions | Actors targeted | Implementing actors |
|
(1) Undeserved awarding of grades by lecturers to bribe-paying students (monetary corruption) |
(1a) Professors respect integrity standards when grading exams (1b) Students refuse to pay if bribes are solicited |
Establish a pay-for-performance scheme that rewards academics who publish in reputable journals with bonus payments Launch an awareness-raising campaign on education-specific corruption, targeting some (randomly selected) university campuses around the country |
Professors Students, student movement |
Ministry of Education, private university managers, donors Organised student bodies, donors |
|
(2) Unmeritocratic promotion of lecturers based on nepotism and favouritism |
(2a) Senior lecturers embody and propagate standards of ethical integrity and academic excellence (2b) Research funding is available and allocated based on merit |
Tighten and formalise the criteria for academic promotion, tying them to research output in reputable international journals and/or student assessments International peer reviewers advise on the allocation of public research funds External research grants are channelled through state (or private) universities rather than non-state research institutes and think tanks, as is now commonly the case in Albania |
Professors Regulators (e.g., AKKShI) Professors |
Ministry of Education, private university managers, donors Ministry of Education, donors Donors |
To attack the first corrupt practice (1), the action plan proposes to combine a pay-for-performance scheme with an awareness-raising campaign. In Albania, public sector salaries are higher than private sector salaries, especially in the education sector – and this is largely for political, rather than productivity, reasons. In principle, universities could afford to slightly decrease the base salary of university lecturers and use the surplus generated to finance one-off bonus payments to lecturers who publish journal articles in reputable international outlets. The size of the bonus could be indexed to the ranking or impact factor of the journal where the publication appears.
Although professors would need to take a small pay cut, potentially increasing incentives to solicit bribes, the pay-for-performance system would also establish an alternative, and more remunerative, source of supplementary income than bribery. Thus, besides promoting higher-quality academic output, the system could also reduce corruption. This is because, when soliciting bribes, corrupt professors incur what economists refer to as ‘transaction costs.’ Bribe takers must identify a potential target, negotiate the transaction in a culturally acceptable manner, keep the exchange secret, build mutual trust, and enforce compliance with the terms of the exchange: all these activities have a cost.7b857b4f877a If, under the bonus scheme, the marginal returns from research and publication, net of marginal costs, substantially exceed the marginal returns from bribe solicitation efforts, net of marginal (transaction) costs, corrupt professors may have an incentive to shift their effort from extorting bribes to doing research.
This measure attacks the demand side of bribes by focusing on those who solicit and collect bribes, that is, professors. To simultaneously attack the supply side, one would need to target those who agree to pay the bribes, that is, students. Anti-corruption practitioners could leverage the recent surge in student mobilisation to establish an honest and constructive dialogue with the student movement on education-specific corruption. Practitioners could then partner with, and fund, student organisations to design and run awareness-raising campaigns on education-specific corruption on a random selection of campuses around the country.
To attack the second corrupt practice (2), the action plan proposes a strategy that combines a reform of promotion rules, a system of top-down monitoring, and a reform of funding channels. Clear promotion standards should link eligibility for advancement to a set of measurable criteria, for example, a minimum number of publications in internationally respected peer-reviewed journals or positive student assessments of teacher performance. This could reduce the likelihood of nepotism and favouritism while fostering the emergence of a cadre of senior professors who embody the standards of ethical integrity and scholarly excellence.
For this to happen, public research funding needs to be sufficiently available to academic departments, and also allocated based on merit. A more meritocratic allocation may be achieved by scaling up the use of international peer reviewers, who are less likely than locally recruited reviewers to know the applicants personally and to have existing relations of reciprocity with them. For instance, AKKShI, the state agency that awards research grants, could enlist the expertise of at least one foreign academic when reviewing and selecting grant applications to fund. Currently, much of the private research funding in Albania is channelled to NGOs and think tanks, some of which are run by university professors seeking to circumvent the complex bureaucracy and high overhead costs of channelling their grants through the universities where they teach. As a result, a lot of research activity flies ‘under the radar.’ Bringing a share of these research monies back to the academy would create incentives for lecturers to compete for promotion based on the amount of funding they can attract.
Step 6: Gather empirical evidence
For each intervention proposed, practitioners should assess its potential effectiveness by reviewing the body of existing evidence, including cross-countries studies (if they exist) or case studies of countries that implemented a version of the intervention in question. Some universities in transition economies, especially in Czechia and Hungary, have experimented with pay-for-performance schemes in order to reward achievement and increase the volume and quality of academic output. However, there remains an evidence gap regarding the impact of both pay-for-performance systems and education campaigns on corruption.3e094deb97ec
At the same time, there seems to be some ‘favourable preliminary evidence’ suggesting that promoting and entrenching meritocratic recruitment can help reduce the incidence of bribery more broadly.38f895c29d6f For instance, Rauch and Evans8a57392bf017 present cross-country evidence of a positive correlation between reliance on merit-based recruitment and lower levels of perceived corruption (although, of course, this relationship may also be taken as evidence of a causal link from corruption to meritocratic recruitment, rather than the other way round, as bribe payments may affect staff appointment decisions). Probably the most robust evidence in the empirical literature on anti-corruption pertains to the effectiveness of top-down audits and other monitoring-based measures.355b1b26a9d2 This suggests that scaling up external monitoring (e.g., through the use of foreign peer reviewers) might be a promising line of intervention.
Still, context is paramount, and anti-corruption practitioners should refrain from one-size-fits-all approaches that simply replicate interventions that have proved successful elsewhere (‘best practices’). For this reason, practitioners should seriously consider generating new empirical evidence from the target country. The aim is to assess, to the extent possible, the probability of success of the proposed interventions and to continue to gather data and information throughout the implementation phase in order to learn and adapt one’s strategy while the intervention is underway (an approach known as ‘flexible programming’). For instance, anti-corruption practitioners in Albania could rely on the Albanian National Student Survey56b6eb2057fb to examine whether variation in the incidence of corruption across different universities and academic departments is related to some important faculty- or university-level characteristics – staff pay, student-teacher ratio, external funding, existing promotion rules, research intensity, ratio of permanent to temporary staff, the university’s public or private status, rural versus urban location, etc. This type of quantitative analysis is important to fine-tune the interventions proposed and make evidence-based policy choices.
Conclusion
There is little evidence to suggest that, in the last two decades, aid-funded anti-corruption interventions based on the systemic approach have helped aid-receiving countries reduce, let alone eliminate, corruption. For this reason, systemic interventions should at least be complemented with more targeted or sectoral anti-corruption approaches. When programming interventions, practitioners should answer two questions. First, what are the ‘smart spaces’ for anti-corruption efforts in the target country – that is, the sectors with the most favourable combination of impact and feasibility? And second, within those sectors, which corrupt practices should be targeted specifically, and what is the right set of anti-corruption policies and interventions?
Using a combination of heuristic tools and empirical evidence from Albania, this U4 Issue has attempted to offer an illustrative framework to help practitioners answer both questions through a six-step process. Of course, not all agencies and practitioners may be able to work in the anti-corruption sectors suggested by the impact/feasibility analysis, whether because of pre-existing donor priorities or because of capacity constraints. Still, our method can be used to identify targets of intervention even within a pre-selected set of alternatives – an approach that is still superior to relying on externally defined priority areas.
This means that anti-corruption practitioners should avoid the dominant tendency to rely exclusively or mainly on international ‘best practices,’ which may lead them to blindly replicate solutions that have proved successful elsewhere – in other countries and/or sectors of intervention. Instead, practitioners should complement these widely recognised approaches with others tailored to the specifics of the local context, taking into account its political and structural constraints. Such locally adapted interventions may be considered ‘second-best,’ yet make better use of scarce aid resources.
Ranking and prioritising interventions is critical. Attacking all forms of corruption at once – as the systemic approach aims to do – is likely to produce limited results while absorbing financial and technical resources that could be employed more effectively in other programme areas. To improve aid effectiveness, donors and practitioners should target one corruption sector at a time. While doing so, they can also be tracking changes in local circumstances that may open up new windows of opportunity for intervention in the next budgeting period. Substantially reducing corruption in one sector may relieve constraints on implementation in other sectors, creating opportunities for sequential interventions. ‘Over time, as more and more organisations are created that are free of corruption – “islands of integrity” – the entire bureaucratic culture of a country could be changed’.ed100fcf5251 At that point, a country would be ready to benefit from the establishment of more ‘systemic’ anti-corruption safeguards.0e141cb75488
In Albania, donors should seriously consider channelling anti-corruption resources into education, which appears to be the corruption sector with the most favourable combination of potential impact and feasibility at the present time. If successful, this approach could open up further opportunities for interventions and/or lead to the emergence of new integrity-minded actors that donors could subsequently enlist as drivers of change. For instance, a corruption-free education system would produce a younger generation that was not schooled in the ways of corruption from as early as high school or university.
Within the Albanian education sector, donors should further explore the feasibility of designing and implementing a range of interventions. Those worth considering include establishing a pay-for-performance system along the lines of the Czech/Hungarian model, restructuring the way public and private research funds are allocated, tightening the standards for academic promotion (as opposed to recruitment), and scaling up the use of international academic monitors – to cite a few examples. Given the geographic distribution of corruption in Albania, donors should also consider targeting education-specific interventions to the country’s southern regions (including their universities), where corruption is perceived to be most prevalent.
List of annexes
Appendix A: Anti-corruption projects in Albania: A recent history
Appendix C: Corruption and economic growth in Albania
Appendix D: Survey methodology
Appendix E: The Albanian political settlement
Appendix F: Petty vs. grand corruption
Appendix G: Anti-corruption tools and techniques: A taxonomy
- World Bank, cited in Bukovansky 2006: 191.
- Marquette 2003.
- UNDP 2016: 6.
- Khan, Andreoni, and Roy 2016.
- Khan 2005; Uberti 2016a; Khan, Andreoni, and Roy 2016.
- Khan 2005.
- North et al. 2012.
- Johnson, Taxell, and Zaum 2012; Gans-Morse et al. 2018; Prasad, Borges Martins da Silva, and Nickow 2019.
- Khan, Andreoni, and Roy 2016.
- 2016.
- Financed by the UK Department for International Development (DFID), the ACE framework builds on a vast body of previous studies on political settlements, rent theory, and the political economy of corruption (Khan and Jomo 2000; Di John and Putzel 2009; Khan 2010; Parks and Cole 2010; North et al. 2012; Gray and Whitfield 2014; Kelsall 2016; Uberti 2016b).
- World Bank, World Development Indicators, 2019.
- World Bank, World Development Indicators, 2019.
- The Corruption Perceptions Index uses a scale from 0 (most corrupt) to 100 (least corrupt).
- Unless otherwise noted, all dollar amounts are US dollars.
- Albania’s economic growth rates have been much more lacklustre since the onset of the eurozone debt crisis.
- Abrahams 2015: 230.
- Treisman 2000; Uberti 2018.
- Khan 2005.
- At low levels of income, rule enforcement is typically constrained by resource shortages. At the same time, competitive markets are undeveloped: firms and businesses are few in number and mostly small to medium in size. For this reason, they can often interact with each other in informal ways, leading to little demand by powerful economic actors for a system of universal rule enforcement. As a country develops, however, the resource constraints on rule enforcement are lifted, and market development leads to an increase in demand for an impersonal rule of law (Khan 2005; Khan, Andreoni, and Roy 2016). Economic development is also typically associated with increasing literacy, higher rates of urbanisation, and the rise of a middle class – all of which are expected to enhance the willingness and capacity of the population to hold corrupt officials to account.
- Uberti 2020.
- UNODC 2011.
- These two estimates are statistically distinguishable from one another at the 5% significance level.
- UNODC 2011; U4 2011.
- Note that the frequency of corrupt transactions in the education sector is statistically significantly lower than in the health sector (the p-value of a paired t-test for equality of the means is 0.000).
- Khan, Andreoni, and Roy 2016: 17.
- Khan 2010.
- Elbasani 2018: 32.
- North et al. 2012.
- North et al. 2012.
- Whaites 2017.
- Abrahams 2015; Uberti 2017.
- Hoxhaj 2020: 172.
- Elbasani 2018: 30.
- It remains to be seen whether the ongoing judicial reform in Albania will eventually succeed in bringing down the level of corruption in this critical sector (Gjevori 2019).
- Uberti 2017.
- UNODC 2011; U4 2011.
- The probability of success (feasibility) can thus be expressed as 1 minus the probability of failure.
- Khan and Jomo 2000.
- Uberti 2017.
- Imami et al. 2018.
- Of course, the rents used for political stabilisation also carry economic value. A long line of research has found a negative relationship between political instability, on the one hand, and economic growth and investment, on the other (e.g., Barro 1991). In this light, the ‘net’ effect of a wasteful PPP agreement may not be to reduce economic growth once its positive influence on political stabilisation is factored in. Still, holding feasibility constant, donors should tackle first those forms of corruption that generate the largest economic distortions while achieving the least political stabilisation.
- The prompt clarified that ‘a score of, say, 1% implies that only a small minority of Albanian citizens are affected by this type of corruption, while a score of 99% implies that almost everyone (including children and the elders) is exposed to this type of corruption.’
- The difference is statistically significant at the 5% level.
- Kirya 2019: 27–28.
- Zhllima et al. 2018: 66.
- Interview with ASCAL official, Tirana, 3 October 2019.
- Interview with ASCAL official, Tirana, 3 October 2019.
- Potrafke 2012; Ivlevs and Hinks 2018.
- Agjencia e Sigurimit te Cilesise ne Arsimin e Larte.
- Qendra e Sherbimeve Arsimore.
- Agjencia Kombetare e Kerkimit Shkencor dhe Inovacionit.
- Zhllima et al. 2018: 59.
- Raxhimi 2019.
- Raxhimi 2019.
- A high-profile research exercise funded by the Swiss Agency for Development and Cooperation (SDC), in which an Albanian team of researchers took part, contributed to raising awareness about this issue in the Western Balkan region. The research was conducted through the Regional Research Promotion Programme (‘Education-Specific Corruption in the Western Balkans’, 2012–13).
- Interview with ASCAL official, Tirana, 3 October 2019.
- Fischer 2010: 434.
- Uberti 2016a.
- Gans-Morse et al. 2018: 174.
- Gans-Morse et al. 2018: 184.
- 2000.
- Gans-Morse et al. 2018.
- Based on the British model, the Albanian student survey was conducted by ASCAL in April–May 2019. It includes questions about perceived and experienced corruption.
- Prasad, Borges Martins da Silva, and Nickow 2019: 101.
- Khan, Andreoni, and Roy 2016.