UNODC’s statistical framework to measure corruption provides a comprehensive set of indicators on corruption and anti-corruption. States can use it to track progress against the recommendations and requirements of the UNCAC.
Blog
Measuring integrity and corruption risks: OECD’s Public Integrity Indicators
The PIIs are objective measures of countries’ integrity. Their impact is growing beyond OECD governments as other countries join – to the benefit of investors, researchers, and donors

This is the 14th in a blog series on anti-corruption measurement tools and their applications. Contributors include leading measurement, evaluation, and corruption experts invited by U4 to share up-to-date insights during 2024–2025.
Evidence on what works and why in curbing corruption and promoting integrity is scarce. Arguably, we need more innovation in anti-corruption work, and in particular better application of technology, but we also need the means to know when the intended results are achieved and when behaviours change for the better, in both public and private sector settings. Policymakers, civil servants, citizens, and businesses also benefit from better information on the strength of integrity safeguards in their country, including international comparisons, and where corruption risks are highest.
The OECD has standardised its indicators on public integrity to help advance the global evidence base and support national reforms.
The OECD has standardised its indicators on public integrity – and the related data collection, analysis, and validation processes – to help advance the global evidence base and support national reforms. Such objective, actionable measures based on state-of-the-art practices in OECD member countries can complement perceptions-based ones, and phase out the use of proxies based on expert judgement. The recent extension of the indicators to countries that are not members of the OECD (63 countries are covered in total) opens up new possibilities to re-examine the anti-corruption toolbox and increase the effectiveness of integrity tools.
Why did the OECD decide to build a new set of indicators? The origins and early goals
In 2019, the OECD began building a set of indicators to monitor implementation of the OECD Council Recommendation on Public Integrity. These were the OECD Public Integrity Indicators (PIIs): intended to provide statistically robust values on levels of integrity and corruption risks across its membership. In essence, this meant:
- Identifying suitable key performance indicators for corruption risks across OECD countries and establishing standard definitions to harmonise approaches.
- Differentiating between measures of regulations (de jure) and practice (de facto).
- Investing the necessary resources in harvesting data from several public registries using advanced analytical methods.
- Sourcing the data only from primary sources and publishing only high-quality, validated evidence.
The PIIs were developed under the auspices of the OECD Working Party on Public Integrity and Anti-Corruption.39d36c08ae97 A dedicated, multi-country Task Force worked for two years to develop the indicators, and continues to play a key role in ensuring that the framework supports the implementation of OECD standards and has a positive impact in member countries. In 2020, following consultations with other international organisations and experts, the 38 OECD member countries adopted the methodology for the first sets of indicators, and in 2021 the ‘Strategy’ dataset was made available. A data portal was launched at the same time to allow countries to easily compare performance and identify best practices.
Although the UN Statistical Framework to Measure Corruption was developed shortly after the PIIs, the main methodological directions are shared. Both emphasise the need to focus on direct and indirect measures of corruption risks, using a combination of perceptions, risk, and response-based indicators covering de jure and de facto dimensions, as explained in a previous blog post in this series.
All indicator designs involve trade-offs. The main philosophy for the PIIs was to prioritise data reliability and validity before universal country or thematic coverage. Establishing a time series was a priority. A sequenced approach was adopted, expanding the thematic coverage gradually. This means that many important areas, such as public procurement and law enforcement (police) are not covered currently. The PIIs also focus on the strength of national systems at the central government level to mitigate corruption risks, not on the extent of transnational corruption risks or enablers. This is a limitation shared with most OECD datasets, purely for feasibility purposes as sub-national level data collection requires more resources. Country coverage has also increased incrementally, as further explained below.
| Datasets | Themes | Structure | Baseline and updates |
| Strategy |
|
8 indicators, 7 criteria-based and 1 numerical |
OECD: 2020 and 2025 Non-OECD: 2024 |
| Accountability of public policy making |
|
15 indicators, 8 criteria-based and 7 numerical |
OECD: 2022 and 2025 Non-OECD: 2024 |
| Risk management |
|
11 indicators, 7 criteria-based and 4 numerical |
OECD: 2023 Non-OECD: 2026 |
| Justice (forthcoming December 9, 2025) |
|
11 indicators, 8 criteria-based and 3 numerical. |
OECD: 2025 Non-OECD: 2025 |
Effective implementation requires timely and accurate data to be available. When countries do not have high-quality, accessible data this is counted as a ‘data gap’ that is hindering implementation. Rather than excluding this variable, as some indices do, the PIIs treat a lack of data as a negative value. No methodological shortcuts – for instance, using expert ratings as proxies for the real data – are used. Surveys of the general population are included when meaningful as broader, outcome-level measures.
Generating high-quality data always has a cost. Going to ‘the source’ and relying on primary data means that both the OECD Secretariat and the countries participating invest a significant amount of effort in producing these datasets. Countries that have good digital registries and record keeping practices can provide the information more easily. The OECD tries to reduce the burden as much as possible by scraping publicly available information where this exists, running the calculations, and sharing these for validation. The accuracy of all data is validated directly with the responsible government officials, meaning that the PII team often has several contact points in the administration at once. The PIIs purposefully invest most resources in measuring implementation and corruption risks. Of the 320 criteria included in the framework, 173 are measuring practice. For numerical indicators, this means harvesting the most promising key performance indicators across the OECD membership and harmonising their methodologies for comparative purposes. Examples include:
- Submission and verification rates of asset and interest declarations.
- Frequency of revolving doors, for ministers and top-tier civil servants.
- Implementation rate of internal audit recommendations.
- Laws adopted through extraordinary procedures in parliament.
- Implementation rate of actions in the national anti-corruption strategy.
Such information is often publicly available in member countries, for example through annual reports of the responsible authorities. Through the PIIs, the OECD supports countries in publishing such information in a comparable manner.
The PIIs essentially consist of two types of indicator:
- Criteria-based indicators measure the extent to which specific OECD standards are met regarding the strength of regulations and institutions. When expressed as percentages, the criteria-based indicators present the share of criteria fulfilled divided by the total number of criteria making up that indicator. Criteria are binary (ie, fulfilled or not fulfilled). The criteria provide actionable steps that governments can take to improve their national anti-corruption and integrity system.58d9d51a1955 In the design phase, it was a major advantage that OECD countries had already defined the construct; ie, what ‘integrity’ means and what steps should be taken to reduce corruption risk. The OECD legal instruments (primarily the OECD Council Recommendation) thus provided the normative framework, but alignment with UN, GRECO, and other regional standards was ensured in each specific policy area.
- Numerical indicators are harmonised key performance indicators that express how effectively a country is mitigating a certain corruption risk. They are more outcome-oriented than the criteria-based indicators.
The PII data portal contains a page for each country. Criteria-based indicators are presented as a series of circles (shaded or empty, according to whether criteria are met), while numerical indicators are presented as bars. All data sets are structured so indicators measuring de jure outputs come first (the first four indicators below) and later come the de facto measures (next three) and the numerical rates (last four).
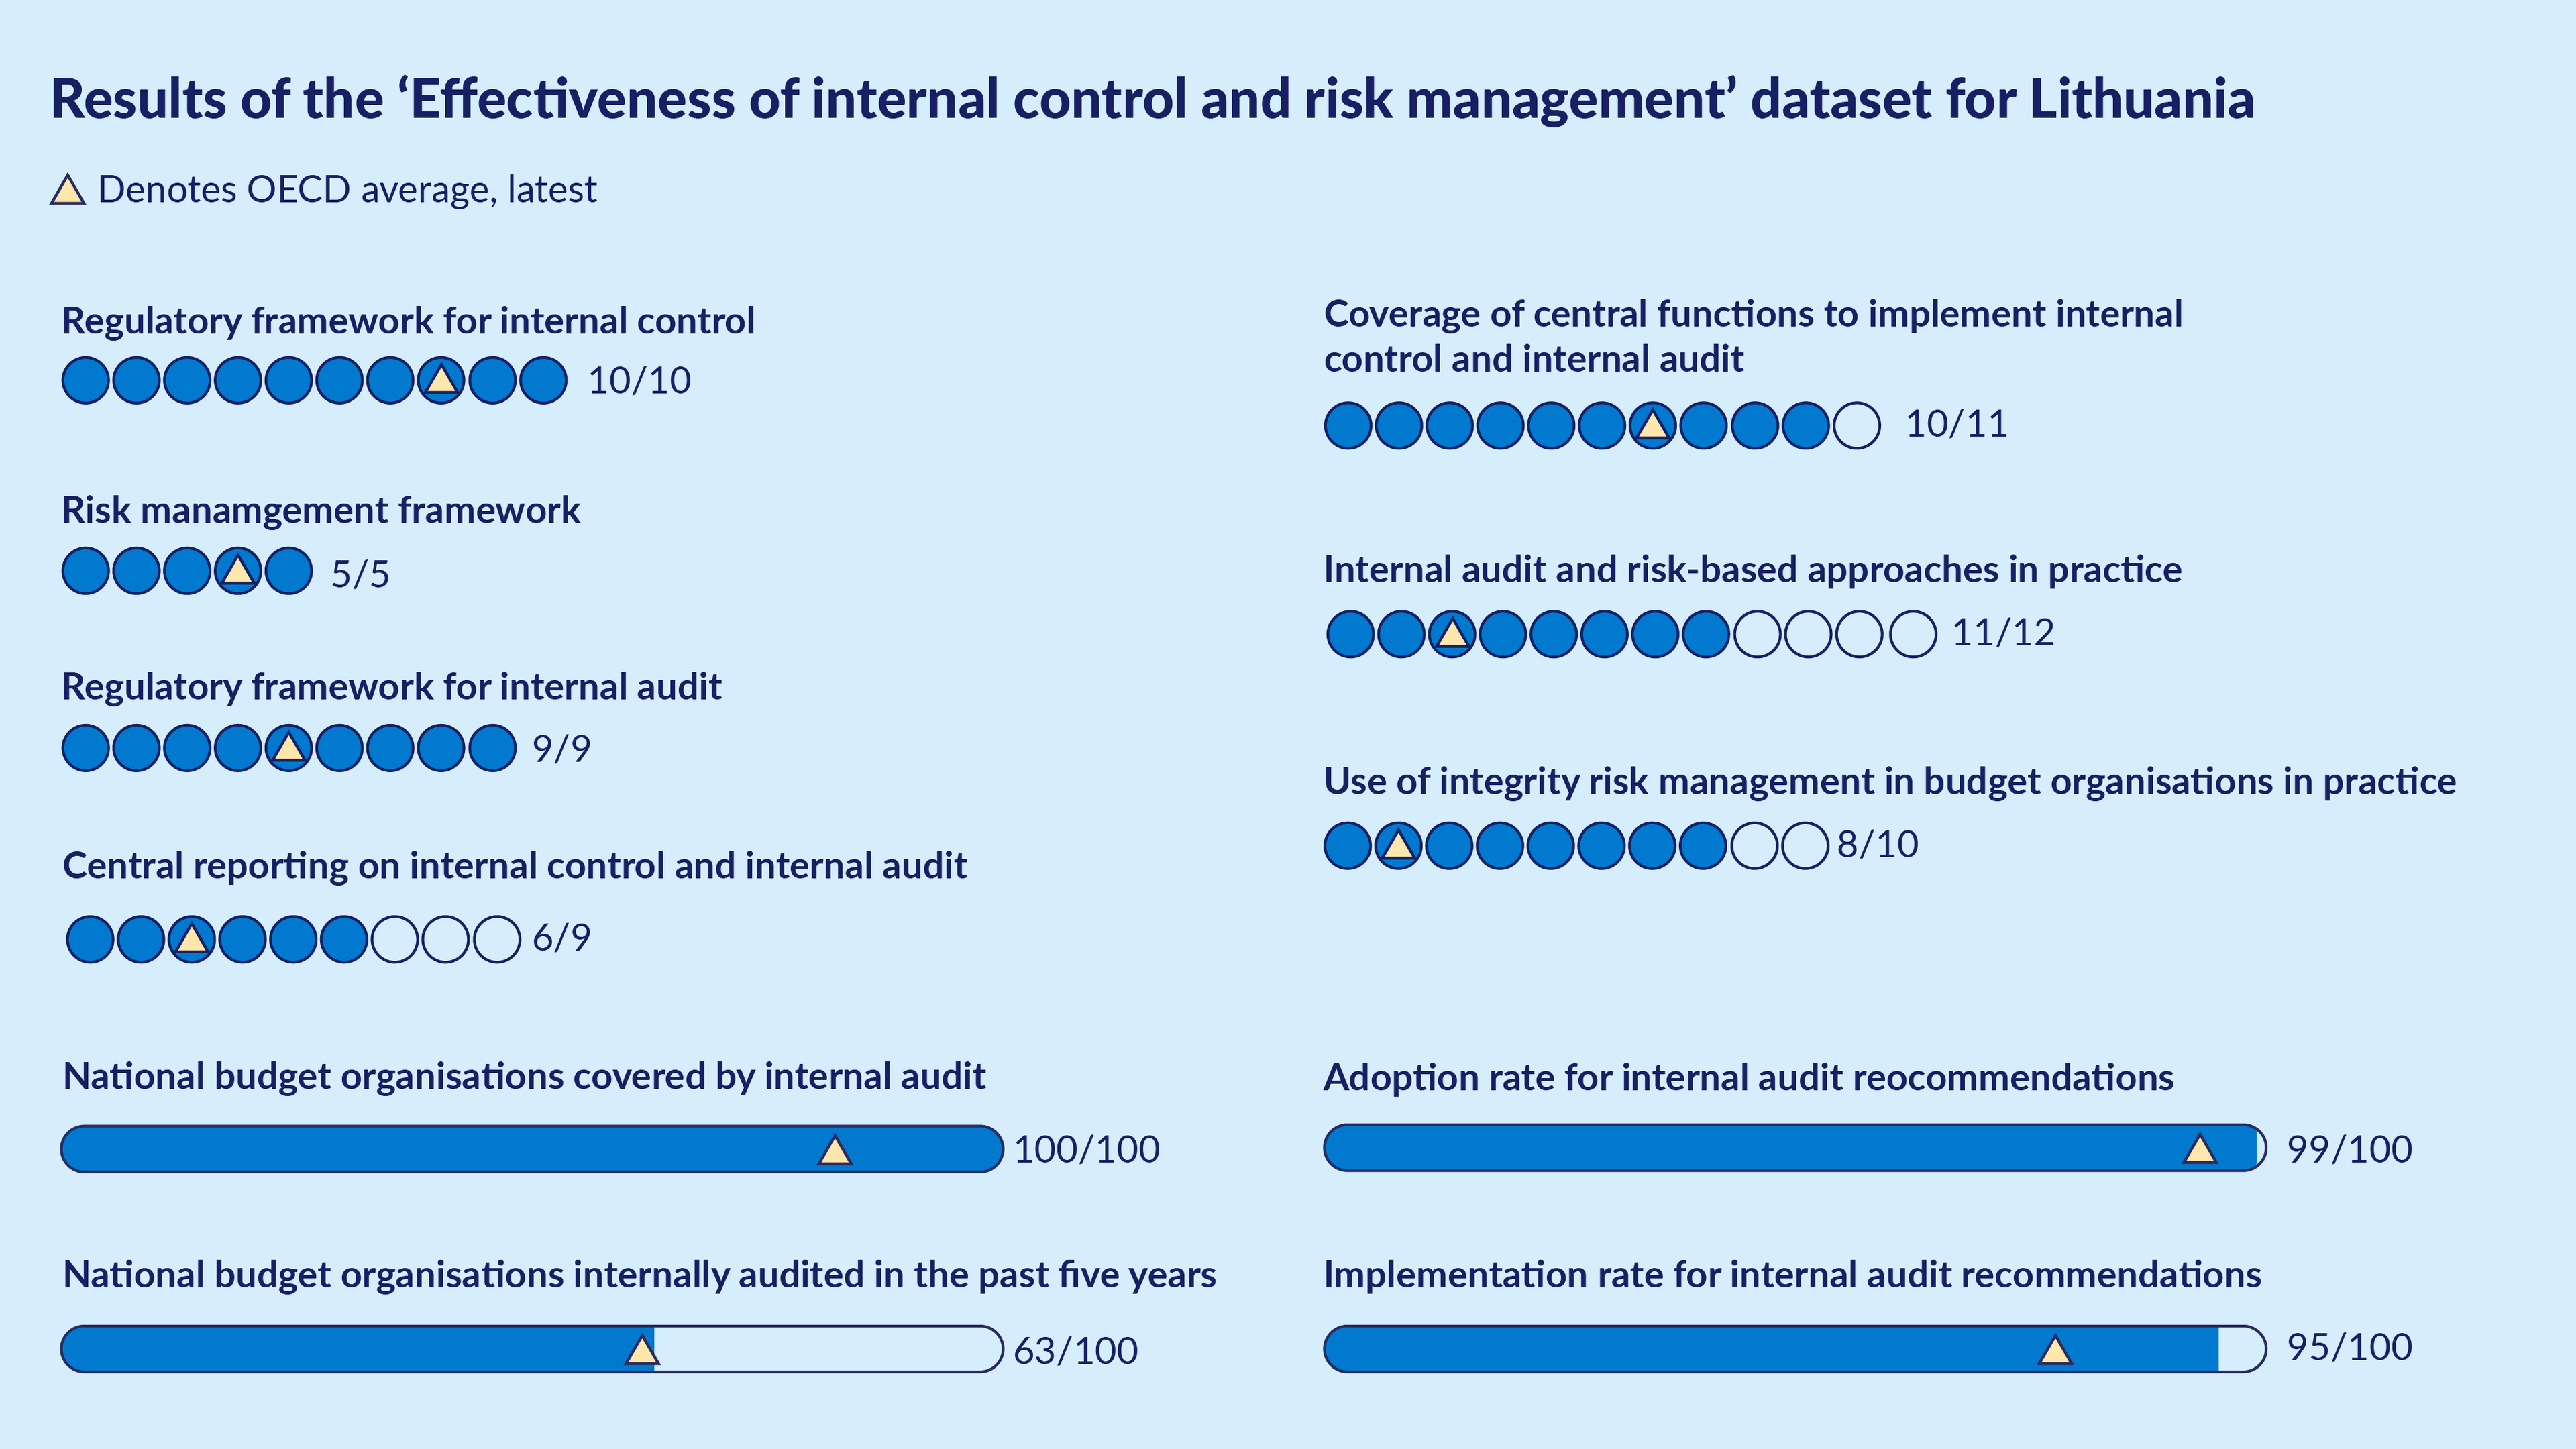
For criteria-based indictors, it is possible to see which individual criteria the country does or does not fulfil (see below), as well as on which criteria the country is leading or lagging, expressed by the number of other countries fulfilling the criterion.
|
✔️ |
A supervisory function in central government oversees transparency of lobbying activities issues. |
17 |
|
|
❌ |
The code of conduct that regulates interactions between public officials and lobbyists is supported by practical examples of at-risk or undesirable behaviours and situations. |
12 |
Lagging |
|
✔️ |
Lobbyists’ registration tools are made accessible for all and detail the registration procedure step by step to support the registrant. |
15 |
|
|
✔️ |
The lobbying register allows to sort information collected at the minimum by lobbyist's name, company or organisation, domain of intervention, and piece of legislation or regulation targeted. |
8 |
Leading |
|
✔️ |
Information disclosed by lobbyists in the register includes their name, organisation, domain of intervention, and type of lobbying activities. |
14 |
Leading |
|
❌ |
Information disclosed by lobbyists in the register include budget/expenses for lobbying activities, and pieces of legislation and regulation targeted. |
4 |
Lagging |
As the datasets grow, more nuanced comparisons become possible.
As the datasets grow, more nuanced comparisons become possible. Initially, the main comparators were the OECD average and the best-performing country. Recently, regional comparisons have become more used as countries often prefer to benchmark against their neighbours first and foremost. Regional workshops are held to facilitate policy dialogue and peer exchange and these often allow for more in-depth analysis and tailored solutions.
The OECD Public Integrity Indicators today: Supporting evidence-based reforms, OECD accession, and better global and regional policies
In March 2024, the first OECD flagship report using this cross-country dataset was published: the OECD Anti-Corruption and Integrity Outlook. It produced two important global findings:
- Countries are facing an implementation gap. Regulations (blue bars in the chart below) are generally strong across the OECD in most policy areas but implementation (green bars) is lagging. A new law can be an important output, but not an outcome in itself. To have an effect on actual behaviour, laws must be implemented. The implementation gap is a general trend, but there is significant variation across countries. Some OECD member countries invest less in detailed regulations but still perform well in practice on the PIIs in specific policy fields.
- A data gap contributes to the implementation gap. The PIIs help identify what essential data on corruption and integrity risks governments need to manage these risks. A lack of effective monitoring hinders enforcement of standards. For example, only 12 OECD countries collect data on whether recommendations by internal auditors are followed by public organisations. And only nine countries track the jobs that senior office-holders take upon leaving public office, and whether these expose them to potential conflicts of interest.

The Outlook report was also accompanied by fact sheets for individual countries, which provide more contextual information on the standard indicators. A universal set of indicators can never capture all the nuances of the different systems and cultures of integrity around the world, and these ‘country notes’ are helpful to explain national particularities.
Beyond the Outlook report, PII data is used in a variety of ways. For example:
- To inspire national-level reforms – such as launching a lobby register or a new national anti-corruption strategy. Once verified by the OECD, updates are reflected in the Portal.
- Whenever a country undertakes an OECD Integrity Review, PII data is updated to reflect the most recent state of play. Such reviews allow the OECD to contextualise the PII data, triangulate it with other sources, and make tailored policy recommendations.
- To inform the OECD Economic Surveys on anti-corruption and public integrity issues. For example, the Ukraine Integrity and Anti-Corruption Review, which was launched jointly with the Ukraine Economic Survey.
- To develop objective benchmarking and reports on countries seeking accession to the OECD (such as Romania).
- When a baseline is set for a new thematic area a data release is announced. Planned future releases cover judicial integrity, external oversight, and merit.
- To underpin the OECD Research Challenge. The 2025 winner combined the PII data with experimental studies on bribery, finding that greater transparency in government decision-making corresponds to lower bribery incidence.
The future of the Public Integrity Indicators: Examining the anti-corruption toolbox, better business cases, and wider coverage
The PIIs are not meant to replace the Corruption Perceptions Index, nor to rank countries according to levels of corruption. Instead, they provide an objective, data-driven diagnostic of a country’s integrity system, helping policymakers identify strengths and areas for improvement.
The comparative power of the PIIs will continue to grow as their coverage expands – through growing time series and additional themes. They can play a crucial role in examining the effectiveness of the existing anti-corruption toolbox and in building evidence-based business cases for specific integrity instruments. A promising avenue is going beyond general perceptions of corruption when analysing what determines foreign direct investment decisions. The inclusion of the PIIs in the forthcoming Foundation for Growth and Competitiveness OECD publication is just one example of how the PIIs can be used to better analyse the relationship between integrity and economic growth.
The extension of the PIIs beyond the OECD membership has been pivotal in these efforts. The data for the 38 member countries is now complemented with data for all nine OECD accession countries and a growing list of others, meaning the Indicators currently cover 63 countries. An update to the Outlook (including the country notes) is scheduled for March 2026. The 2026 edition will feature the new data on judicial integrity, and for the first time include non-member countries. Country notes for non-members have also been added to the website in 2025.
Finally, ongoing pilots to apply the PIIs at sub-national level are helping to providing a fuller picture of local integrity. Central governments need to understand the strengths and weaknesses of sub-national units so it can tailor its strategic approach, and companies need this information to guide investments. An example is a project recently launched with Spanish regional anti-fraud authorities and the commitment of Ukraine to follow up on the national-level Integrity Review with regional-level PIIs.
The PIIs have supported OECD member countries to identify areas of improvement and prompted critical reforms.
The PIIs have supported OECD member countries to identify areas of improvement and prompted critical reforms. They have also paved the way for the first OECD Anti-Corruption and Integrity Outlook, providing cross-country insights. In the future, we hope that academic researchers will make use of this new dataset to generate better and actionable evidence on what works and why in anti-corruption, that businesses will use the data for more reliable investment decisions, and that donor agencies will inform their strategies and programmes based on the PIIs to better protect public funds against waste, fraud, and corruption.
Anti-corruption measurement series
This blog series looks at recent anti-corruption measurement and assessment tools, and how they have been applied in practice at regional or global level, particularly in development programming.
Contributors include leading measurement, evaluation, and corruption experts invited by U4 to share up-to-date insights during 2024–2025. (Series editors are Sofie Arjon Schütte and Joseph Pozsgai-Alvarez).
Explore the other blogs in the series.
Sign up to the U4 Newsletter to get updates, or follow us on LinkedIn.
- At the time of developing the PIIs the Working Party was named Senior Public Integrity officials.
- For example, if the criteria-based indicator ‘Lobbying safeguards in practice’ within the Accountability of Public Policymaking dataset shows a country value of 44%. This means that four out of the nine criteria composing this indicator are fulfilled.
Disclaimer
All views in this text are the author(s)’, and may differ from the U4 partner agencies’ policies.
This work is licenced under a Creative Commons Attribution-NonCommercial-NoDerivatives 4.0 International licence (CC BY-NC-ND 4.0)