Query
Please provide an overview of existing datasets on main sources of licit financial movement in and out of countries, what they cover and whether any analysts have previously used them to make any judgement about the scale of illicit financial flows or the potential for doing so.
Caveat
This Helpdesk Answer analyses the main datasets of licit financial movement that have been used to calculate illicit financial flows, and the list should not be regarded as exhaustive. The Answer does not provide an assessment of these datasets. i.e. whether these datasets are an efficient means to estimate illicit financial flows.
Introduction
Illicit financial flows (IFFs) are defined as “funds which are illegally earned, transferred, and/or utilised across an international border” (Global Financial Integrity 2020: 5). These flows may be related to market or regulatory abuse, tax abuse as well as the proceeds of corruption or crime (Roy and Khalid 2015: 4-5). However, since laws vary between territories, “illicit” flows may not necessarily always be illegal in all jurisdictions contemporaneously. Moreover, the behaviour of uncertain legality is more likely to go unchallenged by a tax system with limited capabilities to report on corporate tax evasion or a political system with little to no will to tackle the theft of state funds (Cobham 2016).
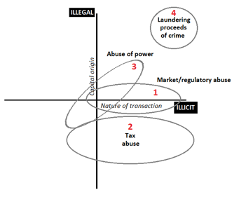
Source: Cobham, A. 2016. Post-2015 Consensus: IFF Assessment. Copenhagen Consensus Center.
The figure above shows how IFFs can fit into one of four categories, illustrating that the source funds for IFFs may be perfectly legal, while the avoidance of tax, for example, may be technically legal yet illicit by societal norms. Other experts believe the current definition does not include tax avoidance because it is not illegal per se, but that it should be included (Picciotto 2018). Others believe tax avoidance should be treated separately from dirty money and therefore not included in the definition (Forstater 2018). Nonetheless, IFFs are by nature hidden, regardless of whether they are illegal or simply unacceptable to the public (Cobham 2016).
Recognising that countries with low rates of domestic resource mobilisation are unable to develop in a sustainable fashion, the international community included efforts to curb illicit financial flows in target 16.4 of the 2030 Agenda (United Nations 2015). This was followed by the adoption by the Inter-agency and Expert Group on SDG Indicators of target 16.4.1 “total value of inward and outward illicit financial flows”, with efforts to measure IFFs receiving greater policy attention (UNODC/UNCTAD 2018).
Nonetheless, directly measuring IFFs is a challenging task due to their clandestine nature, and most estimates are based on anomalies in data about licit financial movements rather than through direct measurement (Roy and Khalid 2015: 5; UNCTAD 2018: 4).
Main methods of estimating illicit financial flows
There are four main methods used to estimate specific types of IFFs: the Hot Money Method, the Dooley Method, the World Bank Residual Method and the Trade Mispricing Method. According to UNECA (2015: 90):
- The Hot Money Method estimates commercial-related IFFs through net errors and omissions in payment balances provided in different datasets. These anomalies are regarded as including illicit financial flows (Roy and Khalid 2015: 6).
- The Trade Mispricing Model assesses trade-related IFFs by looking for disparities arising from over-invoicing of imports and under-invoicing of exports after adjusting for ordinary price differences.
- The World Bank Residual Method estimates commercial-related IFFs as the difference between the source of funds (external debt and foreign direct investment) and the use of funds (current account deficit and reserves).
- The Dooley Method relies on the privately held foreign assets reported in the balance of payments that do not generate investment income.
Currently, a UNCTAD/UNODC Task Force is working to develop practical guidelines and a White Paper for a Statistical Framework for the Measurement of Illicit Financial Flows to be submitted to the United Nations Statistical Commission (UNSC). While further methodological materials are under development, a few early suggestions revolve around the discussion on different types of IFFs and their measurement in detail (UNODC/UNCTAD 2018).The proposed methodology for the SDG indicator 16.4.1, which is aimed at calculating the total value of inward and outwards IFFs as part of achieving the SDG target, is the computation method (UNODC/UNCTAD 2018). The method includes a two-step process, with the first step involving a risk assessment to identify major and most relevant sources of IFFs in a country based on or building on existing risk assessments. Four main types of activities that can generate IFFs are mentioned as follows (UNODC/UNCTAD 2018):
- Tax and commercial IFFs: these include, but are not limited to, unlawful practices such as tariff, duty and revenue offences, tax evasion, corporate offences and market manipulation. Other activities that are non-observed, hidden or informal or are a part of the so-called shadow, underground or grey economy may generate IFFs, including tax avoidance, transfer mispricing, debt shifting, relocation of intellectual property, tax treaty shopping, tax deferral and changing corporate structures and headquarter locations. When such activities directly or indirectly generate flows crossing country borders, they create IFFs.
- IFFs from corruption: when acts of corruption, such as bribery, embezzlement, abuse of functions, trading in influence, illicit enrichment, directly or indirectly, result in cross-border flows, they create IFFs.
- Theft-type activities and financing of crime and terrorism: a forced, involuntary, and illicit transfer of economic resources between actors, such as theft, extortion, illicit enrichment and kidnapping. When the associated financial flows cross country borders, they comprise of IFFs.
- IFFs from illegal markets: domestic and international trade in illicit goods, such as drugs, firearms or services such as smuggling of migrants. IFFs are produced by the flows linked to the international trade of illicit goods and services, as well as by cross-border flows from operating the illicit income from such activities.
After identifying the source activity, the second step will involve estimating flows in a disaggregated manner, with each type of flow being calculated in a different method using both quantitative and qualitative information obtained from financial authorities, central banks and other entities concerned with money laundering and financial crimes (UNODC/UNCTAD 2018). SDG indicator 16.4.1 calls for the measurement of the “total value” of inward and outward IFFs. While such an indicator is a useful assessment of the overall size of the problem and for measuring progress, a more nuanced measurement of IFFs helps to identify the main sources and channels of IFFs and can guide interventions targeting IFFs. Thus, this approach states that countries are affected by different types of IFFs, and it suggests that the main types of IFFs be defined at the country level (UNODC/UNCTAD 2018).
Datasets of licit financial movement and their use in estimating IFFs
Bank for International Settlements (BIS) datasets
The Bank for International Settlements (BIS) collaborates with central banks and other national authorities to compile statistics on vital information such as financial stability, international monetary spillovers and global liquidity (BIS 2019a). The BIS produces two datasets of interest here: locational banking statistics (LBS) and consolidated banking statistics (CBS).
The LBS is a bilateral analysis of capital flows between countries, capturing the currency and geographical composition of internationally active banks’ balance sheets (BIS 2019a: 9). This means that it covers banking activities across borders, focusing on locations of the banking office. It covers the majority of the world’s transnational bank deposits, and all significant banking centres contribute to the dataset.
The CBS captures the country risk exposures of internationally active banks and provides simple measures of exposures that are intended to be comparable across the banks of different countries (BIS 2019b: 21). It is compiled according to the nationality of banks on a worldwide consolidated group basis, similar to the consolidation approach followed by banking supervisors (BIS 2019b: 21).
A recent World Bank policy research working paper used the LBS to interrogate the relationship between aid disbursement and IFFs (Andersen et al. 2020). The researchers used LBS data from 1977 to 2010, breaking down each country’s total deposits in haven and non-haven jurisdictions. The results showed that quarterly growth rates in haven deposits were significantly higher than in non-haven deposits (Andersen et al. 2020: 6), which shows that the majority of depositors preferred offshore financial centres that offered secrecy laws and tax havens. The dataset was compared with aid disbursement over the same period from the World Bank Project Database, which contained information such as approval date, commitment amount, sector and instrument type for each sponsored project. Their finding was that aid disbursement to highly aid-dependent countries coincided with a sharp increase in bank deposits in offshore financial centres but not in other financial centres. The authors concluded that, in many instances, aid was captured by ruling elites and diverted to offshore havens (Andersen et al. 2020).
Similarly, Alstadsæter et al. (2018: 90) used the LBS to estimate the amount of wealth held by each country in offshore tax havens around the world. According to their findings, wealth equivalent to about 10% of world GDP is held in tax havens globally, although the proportion varies a lot between countries, with Scandinavian countries owning the equivalent of only a few percent of GDP in offshore wealth, while this figure rises to about 15% in continental Europe, and to almost 60% in Russia, the Gulf countries and a number of Latin American countries (Alstadsæter et al. 2018: 95).
While the dataset is important for showing the amount of deposits in tax havens which may be used in estimating IFFs, it does not allow an assessment of whether the origin of the funds is licit or illicit. Hence, the dataset needs to be combined with other datasets or specific qualitative analysis to estimate IFFs.
International Monetary Fund’s Direction of Trade Statistics (DOTS) database
The Direction of Trade Statistics (DOTS) “presents the value of merchandise exports and imports disaggregated according to a country’s primary trading partners” (IMF 2020a). It depicts trade flows between major areas of the world, including area and world aggregates. According to the IMF (2020a), reports on imports are based on a cost, insurance and freight (CIF) basis and exports are based on a free on board (FOB) basis with the exception of which imports are also available FOB.
Global Financial Integrity (GFI) uses the DOTS database to estimate IFFs for all countries. For instance, it selected DOTS bilateral reports for 148 countries trading with 36 advanced economies between 2006 and 2015 (Global Financial Intergrity 2019). GFI’s data on potential trade misinvoicing was derived from anomalies in import and export data reported between the trading partners. The methodology involved identifying mismatches between import/export values reported by a developing country with the associated export import values reported by its advanced economy trading partner. When the gap for each mirror pair was negative, that value discrepancy was classified as potential under-invoicing. Conversely, when the gap for a mirror pair was positive, the value discrepancy was classified as potential over-invoicing. Those gaps were then divided by the total export and import trade with advanced economies measured as an average of developing country’s reported trade with the advanced country and the advanced country’s reported trade with the developing country to obtain an estimated scale of IFFs. It estimated that potential misinvoicing averaged around 25% of total developing country trade during that period. (Global Financial Integrity 2019: 1-3).
The DOTS-based estimates of IFFs in 2015 (Global Financial Integrity 2019: vii) highlighted that the top 30 countries, ranked by dollar value of illicit outflows, included resource rich countries such as South Africa (US$10.2 billion), European countries, including Turkey (US$8.4 billion), Latin American nations such as Mexico (US$42.9 billion) and Asian states including Malaysia (US$33.7 billion). The top 30 countries, ranked by illicit outflows as a percentage of total trade with advanced economies produced an entirely different group of countries including Mozambique (48.1%), Malawi (44.1%), Zambia (43%), Honduras (39.7%), Namibia (38.7%) and Myanmar (30.8%). For the list of top 30 countries ranked by dollar value of illicit inflow, top countries included Vietnam (US$22.5 billion), Thailand (US$20.9 billion), Panama (US$18.3 billion), Kazakhstan (US$16.5 billion), Indonesia (US$15.4 billion), Belarus (US$6.1 billion), Argentina (US$4.8 billion) and Morocco (US$3.9 billion).
The reliability of the dataset is the main challenge. Global Financial Integrity conceded in its 2011 report that IFF estimates from developing countries at the regional and national levels could differ from its previous report because of revisions of DOTS data supplied by member states (Kar and Freitas 2011: 3). Hence, better data would be needed to produce reliable estimates rather than working on the assumption that all anomalies in the data are attributable to IFFs (UNCTAD 2018).
The IMF has warned against measuring IFFs using discrepancies in macroeconomic datasets (Inter-agency and Expert Group on SDG Indicators 2015: 280). It stated that estimates of trade misinvoicing cannot be derived from datasets such as DOTS as the trade invoices submitted by an importer and exporter could match though there are IFFs, and conversely, they might mismatch even when there is no illicit trade. It concluded that “estimates of IFF should be based on an understanding of a specific country's circumstances and on administrative data e.g., customs reports and banks’ records” (Inter-agency and Expert Group on SDG Indicators 2015: 280).
International Monetary Fund’s Balance of Payments (BOP)
The balance of payment (BOP) is “a statistical statement that summarises transactions between residents and non-residents during a [given] period” (IMF 2020b). It consists of data drawn from the goods and services account, the primary income account, the secondary income account, the capital account and the financial account.
Global Financial Integrity (2019: ix-x) estimates potential trade-related IFFs as the sum of estimated potential trade misinvoicing and unrecorded BOP flows which are labelled as “net errors and omissions” by the IMF. The approach relies on the assumption that those unreported inflow or outflow leakages represent unrecorded and presumably illicit transactions, although it acknowledges that they may include legitimate reporting errors in the compilation of the BOP account to some extent (Global Financial Integrity 2017: 46).
Since the 6th edition of the IMF’s BOP Manual (2009), most countries have started publishing bilateral balances of payments, with Switzerland and tax havens inside the European Union (including Ireland, Luxembourg, Belgium, Netherlands, Malta, and Cyprus) also reporting harmonised statistics to Eurostat (Tørsløv et al. 2020: 20). Tørsløv et al. (2020) used the bilateral BOPs published by tax havens to develop a methodology for estimating the amount of profit shifted into each haven and the amount of profit lost by individual high-tax countries. The results showed that approximately 40% of multinational profits (more than US$700 billion in 2017) are shifted to tax havens each year (Tørsløv et al. 2020).
Ndikumana and Boyce (2010: 472) used BOPs to calculate capital flight in 33 sub-Saharan African countries over the period from 1970 to 2004. Capital flight was estimated as “the residual difference between inflows and outflows of foreign exchange recorded in the balance of payments, with corrections for the magnitude of external borrowing, trade misinvoicing, and unrecorded remittances”. Based on their calculations, they concluded that sub-Saharan Africa was a net creditor to the rest of the world as the figures of capital flight from these countries, amounting to US$443 billion, were higher than their external debts, which amounted to US$193 billion.
The BOP data supplied by countries may be inaccurate, which compromises the accuracy of IFF estimations derived from the dataset. For instance, Global Financial Integrity conceded in its 2011 report that IFF estimates from developing countries at the regional and national levels could differ from its previous report because of revisions of BOP data supplied by member states (Kar and Freitas 2011: 3).
United Nations Commodity Trade Statistics Database (UN Comtrade)
The UN Comtrade is the largest deposit of international trade data with detailed import and export statistics reported by the statistical authorities of more than 220 countries and areas. It concerns annual trade data from 1962 to the present, and the data is published annually in the International Trade Statistics Yearbook.
Comtrade is widely regarded as a more detailed reflection of an individual country’s global trade activity than the IMF’s DOTS (Global Financial Integrity 2019: iii). Compared to DOTS, Comtrade offers researchers “more comprehensive information on bilateral trade and flexibility in designing the statistical framework with which robust inferences can be made” (Global Financial Integrity 2019: 9). This means that it provides the possibility to determine trade gaps between countries.
The Global Financial Integrity (2019: 9) calculates trade-based IFFs using Comtrade data in a similar manner to the DOTS data (the Hot Money method of estimating IFFs through net errors and omissions in import and export data reported between the trading partners), except that the Comtrade gaps are calculated for each of up to about 5,000 HS-6 digit commodity classes available. Each yearly mirror trade provided in Comtrade consists of data on both the value (in dollars) and volume (in physical units) of the reported trade. Both the values and volumes are used to estimate potential trade misinvoicing through preliminary data treatments (readjusting data to mitigate potential distortions in the estimates), free on board (FOB) equivalents, raw trade gaps and weighted trade gaps (Global Financial Integrity 2019: 9).
For Comtrade-based estimates of IFFs in 2015, the Global Financial Integrity (2019: viii) highlighted that the top 30 countries, ranked by dollar value of illicit outflows, included European countries such as Hungary (US$7.6 billion), Latin American countries such as Mexico (US$31.5 billion), Asian nations such as Malaysia (US$22.9 billion), and African nations such as South Africa (US$5.9 billion). The top 30 countries, ranked by illicit outflows as a percentage of total trade with advanced economies, produced a different set of countries such as Uganda (14.7%), Rwanda (13.7%), and Namibia (13.6%), as well as Costa Rica (12.5%), Colombia (12.1%) and Guatemala (11.9%). The list of top 30 countries ranked by dollar value of illicit inflows included a regionally diverse group such as Poland (US$32.3 billion), Romania (US$6.8 billion), Indonesia (US$10.1 billion), Bangladesh (US$2.8 billion), Chile (US$3.2 billion), Colombia (US$2.9 billion), Morocco (US$2.7 billion) and Tunisia (US$2.3 billion).
As with the DOTS, the IMF has warned against measuring IFFs using discrepancies in UN Comtrade as the trade invoices submitted by an importer and exporter could match though there are IFFs, and conversely, they might mismatch even when there is no illicit trade (Inter-agency and Expert Group on SDG Indicators 2015: 280).
Another challenge is that countries have different reporting practices, which will result in discrepancies in Comtrade data which may mistakenly be considered as IFFs (Hunter 2018: 14). For instance, a 2016 report by UNCTAD illustrated how variations in reporting can result in false positives of IFFs. The report analysed discrepancies in international trade data in the Comtrade database for seven country-commodity pairs, including gold exports from South Africa. It calculated that “virtually all gold exported by South Africa leaves the country unreported”, pointing fingers at mining companies of smuggling billions of dollars’ worth of gold (UNCTAD 2016: 28). The South African government objected to the report, and in turn commissioned a report from economics consultancy Eunomix. The consultant concluded that mining companies and public agencies report gold exports, but not in a format compatible with UN Comtrade's requirements (Mineral Council South Africa 2016). As such, they were able to account for three-quarters of the discrepancy in trade statistics. Hence, the experience of UNCTAD highlighted that one cannot automatically assume that Comtrade discrepancies in trade statistics are indications of IFFs.
Foreign Affiliates Statistics (FATS)
A foreign affiliate is defined as “an enterprise resident in the compiling country over which an institutional unit not resident in the compiling country has control, or an enterprise not resident in the compiling country over which an institutional unit resident in the compiling country has control” (Eurostats 2012: 13). The Foreign Affiliate Statistics (FATS), which are disseminated by organisations such as Eurostats, the OECD and national statistical agencies, describe the overall activity of foreign affiliates divided into inward and outward FATS. Inward FATS show statistics of the activity of foreign affiliates resident in the compiling economy, whereas outward FATS show statistics of the activity of foreign affiliates abroad controlled by the compiling economy (Eurostats 2012: 13).
Tørsløv et al. (2020: 16) used FATS datasets and bilateral balance of payments data published by tax havens to estimate the amount of profit shifting to tax havens by multinational companies and the profit and tax revenue losses incurred by each country from such shifting. The study showed that approximately 40% of multinational profits (more than US$700 billion in 2017) are shifted to tax havens each year.dbd665487b20 Such profit shifting decreases corporate income tax revenue by more than US$200 billion, or 10% of global corporate tax receipts (Tørsløv et al. 2020).
Foreign direct investments datasets
Datasets for foreign direct investments may be used to calculate IFFs related to base erosion and profit shifting (Roy and Khalid 2015: 5-7). For instance, the United Nations Conference of Trade and Development (UNCTAD) provides a database that documents and analyses global and regional trends on foreign direct investments. In the World Investment Report of 2015, UNCTAD analysed the extent of irregularities in reported (taxable) income when foreign direct investments were deposited into developing countries via identified tax havens and special purpose entity (SPE) locations. According to the estimates, around $100 billion is lost annually by developing countries via this channel due to base erosion and profit shifting (UNCTAD 2015: 200).
Damgaard et al. (2019) used FDI data to create a global network that maps all bilateral investment relationships, disentangling phantom FDI from genuine FDI. Only 10 countries (Luxembourg, the Netherlands, Hong Kong SAR, the British Virgin Islands, Bermuda, Singapore, the Cayman Islands, Switzerland, Ireland and Mauritius, which are all known as tax havens) host more than 85% of all phantom investments which are valued at US$15 trillion globally. It revealed that Luxembourg’s $4 trillion in FDI, which comes to $6.6 million a person (600,000 population) is as much as the FDI for the United States and much more than China. Furthermore, it showed that in less than a decade, phantom FDI has climbed from about 30% in 2009 to almost 40% of global FDI in 2017, showing increased activities in tax havens (Damgaard et al. 2019).
International Centre for Tax and Development and UNU-WIDER Government Revenue Dataset (ICTD–WIDER GRD)
The Global Revenue Dataset (GRD) is a compilation of data from multiple international and country-level sources on government revenues, which allows for more reliable and comparable cross-country tax research (Prichard 2016: 51). The GRD Explorer tool allows users to access the GRD, compare countries, regions, and indicators and visualise the data. It derives its information from sources such as IMF GFS, IMF Article IV report, the OECD Tax Statistics, the OECD Revenue Statistics in Latin America, the United Nations Economic Commission for Latin America and the Caribbean, the African Economic Outlook, Africa Tax Dataset, the World Bank World Development Indicators and the Michigan Ross World Tax Database (Prichard 2016: 51).
Cobham and Jansky (2017) used the GRD to calculate revenue loss from tax avoidance. The dataset was mainly used to re-estimate the earlier work of Crivelli et al. (2016), who had estimated that global revenue losses were around US$650 billion annually, of which around one-third was related to developing countries. Crivelli et al. had used data on corporate income tax (CIT) revenues and statutory tax rates from the private dataset of the IMF’s Fiscal Affairs Department in estimating revenue loss, and there had been concerns over the accuracy of revenue statistics (Cobham and Janksy 2017: 3). Cobham and Janksy (2017: 6, 8-10) mitigated this concern by using GRD statistics deemed as a potential alternative offering “consistent, high quality, public data source for revenues”. According to their findings, global revenue losses are estimated at around US$500 billion annually compared to US$650 billion by Crivelli et al., and that the greatest intensity of losses occurs in low- and lower middle-income countries, and across sub-Saharan Africa, Latin America and the Caribbean, and South Asia (Cobham and Janksy 2017: 21).
Though GRD offers more complete and accurate information about levels of tax collection and trends over time, Pritchard et al. (2016: 2) warn that the dataset may be subject to inherent flaws derived from weak national data collection processes. The poor quality of government revenue data in existing sources may compromise the GRD dataset (ICTD/ UNU-WIDER 2020: 9). Potential inconsistencies may appear across countries, or over time, in the disaggregation of tax revenue between taxes on international trade and taxes on goods and services, reflecting potential inconsistencies in the classification of taxes on goods and services collected at the border by customs officials (ICTD/ UNU-WIDER 2020: 10). The ICTD and UNU-WIDER (2020) also caution that GRD statistics may sometimes appear slightly less complete (in terms of disaggregation) than that in, for example, the government finance statistics, which may be as a result of using IMF Article IV data that, while not as detailed, allow the resource component of tax to be isolated.
Corporate Tax Statistics Database
The OCED released in June 2020 the corporate tax database which aggregates information on the global tax and economic activities of nearly 4,000 multinational enterprises headquartered in 26 jurisdictions and operating across more than 100 jurisdictions (OECD 2020). The dataset came as a result of the 2015 base erosion and profit shifting (BEPS) Action 11 report on Measuring and Monitoring BEPS which pointed out the lack of quality data on corporate taxation as a major limitation to the measurement and monitoring of the scale of BEPS and the impact of the OECD/G20 BEPS project (OECD 2020: 1). The dataset is intended to assist in the study of corporate tax policy and expand the quality and range of data available for the analysis of base erosion and profit shifting (OECD 2020: 1).
According to the OECD (2020: 22), the aggregated country-by-country reports used in the database are subject to limitations such as:
- Most data is too aggregated to allow detailed investigation of specific base erosion and profit shifting channels (for example, there is no distinction between royalties and interest in related party payments, and no information on intangible assets).
- Data based on financial accounting might not accurately represent how items are reported for tax purposes. Differences in accounting rules could affect the comparability of data between jurisdictions.
- Several jurisdictions are yet to submit aggregated country-by-country statistics to the OECD for publication, affecting a broader coverage of tax statistics and getting a full picture on tax activities by multinational companies.
- In the absence of specific guidance, multi-national companies may have included intra-company dividends in profit figures. This means that profit figures could be double counted, compromising the accuracy of the datasets.
- In the case of stateless entities, the inclusion of transparent entities, such as partnerships, may give rise to double counting of revenue and profit, compromising the accuracy of the dataset.
- Inclusion of pension funds or university hospitals could distort the relationship between profits and taxes.
Coordinated Direct Investment Survey and the Coordinated Portfolio Investments Survey of the IMF
Centre d’études prospectives et d’informations internationales (CEPII) used this bilateral dataset to identify grey zones (which are potentially unethical) in global finance (CEPII 2020). Their finding was that the bulk of international assets in tax havens are “abnormal”, i.e. unexplained by standard gravity factors, and that such abnormal assets are increasing over time while being concentrated in six main jurisdictions: the Cayman Islands, Bermuda, Luxembourg, Hong Kong, Ireland and the Netherlands (CEPII 2020). Such a discovery is of significance because the agenda on tax avoidance and global finance might interact more than has been expected. If tax avoidance generates disproportionate assets of securities in certain jurisdictions, then the fight against it, especially in the context of shrinking fiscal space due to the COVID-19 crisis, might have unintended consequences on global financial balances (CEPII 2020).
Tax Justice Network’s Illicit Financial Flows Vulnerability Tracker
The Tax Justice Network launched in June 2020 the Illicit Financial Flows Vulnerability Tracker which measures and visualises the vulnerability of a country to various forms of illicit financial flows over different periods of time. It is intended to assist countries to identify the trading partners and channels that create the greatest IFFs risks to their economies (Garcia-Bernado 2020). The eight channels identified include bank deposit (outward and inward), direct investment (outward and inward), portfolio investment (outward and inward) and trade (imports and exports). Data on banking positions is collected from the Bank for International Settlements, foreign direct investment from the IMF’s Coordinated Direct Investment Survey series, portfolio investment from the IMF’s Coordinated Portfolio Investment Survey series and trade data from the UN Comtrade database.
For each country, the IFFs Vulnerability Tracker captures (Tax Justice Network 2020):
- Vulnerability of the country’s trade, investment or banking partners based on their financial secrecy. The vulnerability is calculated as the average financial secrecy level of all partners with which the country trades or invests in for a given channel, weighted by the volume of trade or investment each partner is responsible for. For example, where a country receives most of its inward foreign direct investment from a top tax haven such as the Cayman Islands, the country would have a high vulnerability measure on inward foreign direct investment.
- Intensity reports the share of a gross domestic product (GDP) that the channel is responsible for, assisting in capturing the importance of the channel to the country. For instance, inward foreign direct investment may represent 10% of a country’s GDP, resulting in an intensity score of 10%.
- Exposure combines a channel’s vulnerability and intensity to estimate the share of a country’s GDP exposed to IFFs by that channel. Comparisons of the exposure levels of different channels help countries identify the channels that pose the most IFF risk to their economies. For instance, where the vulnerability of a country’s inward foreign direct investment channel is 76, and the channel accounts for 10% of the country’s GDP, this country’s exposure score would be 7.6%. This equates to 7.6% of this country’s GDP being invested from an entirely secretive jurisdiction (100% of secrecy score).
Financial Action Task Force (FATF) Anti-Money Laundering and Combating the Financing of Terrorism (AML/CFT) related data and statistics
FATF lists examples of data items deemed useful to collect and maintain for the purpose of mutual evaluations or other purposes (including but not limited to tracking illicit financial flows) while cautioning that such statistics may vary depending on national circumstances (FATF 2015). These national datasets could range from the “number of legal persons and arrangements created and operating in the jurisdiction, broken down by: type of legal person and arrangement” to the number and value of suspicious transaction reports (STR) received (FATF 2015).
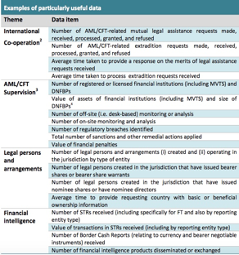
Source: Financial Action Task Force (FATF). 2015. AML/CFT Related Data And Statistics pp26-29.
A report measuring OECD member countries’ responses to IFFs put together by Hansen (2014) used such publicly available FATF data. The report draws on money laundering, tax evasion and international bribery, which make up the bulk of IFFs, describing the situation in these policy areas and the role of donor agencies. For example, when assessing the anti-money laundering regimes that are most effective for countering financial crime and IFFs, Hansen used FATF datasets on financial secrecy laws, customer due diligence and record keeping, and the transparency of legal persons, among others (Hansen 2014). The findings of the report highlighted the need for strengthening customer due diligence, regulation and supervision, and beneficial owner requirements across OECD member states (Hansen 2014). Through the 2014 OECD report, it may be understood that while FATF data may not assign a quantitative value to IFFs, it does indicate their potential sources and destinations.
Indirect sources
Due to the challenges of tracking IFFs, indirect mechanisms may be employed to identify the source and/or destination of illicit financial flows. Public disclosure of the beneficial owners of corporate vehicles through the creation of public registers, for example, may be one such mechanism that makes it easier to flag irregularities and improve checks and balances in the global financial system (Roy and Khalid 2015).
Another indirect source is the OECD’s Automatic Exchange Portal which provides a comprehensive overview of the work the OECD and the Global Forum on Transparency and Exchange of Information for Tax Purposes do in the area of the automatic exchange of information. The Automatic Exchange of Information Initiative has resulted in the voluntary disclosure of offshore accounts, financial assets and income by countries (OECD 2019). Thus, it provides key data on offshore activities by residents of a country.
Crime and corruption-related IFFs
While major datasets capture tax or commercial-related IFFs, they fall short on calculating IFFs related to crime and corruption. According to Hunter (2018: 14), the problem with depending on economic data is that they inherently give greater weight to commerce IFFs, drawing less focus on crime and corruption-related IFFs. This is relatable to the report from the High Level Panel on IFFs from Africa which noted that while research shows corruption constitutes only 5% of IFFs globally, some believe that this is not the case in Africa, and most respondents to the survey for the report felt that corruption was a major source of IFFs from their countries (AU/UNECA 2015: 32).
Large-scale, official datasets on BOP or trade are unable to take into account flows resulting from illicit activities, such as contraband, smuggling and black market activity, since profits from such activities are not captured in national accounts (Hunter 2018: 13). The same applies to corruption, which cannot be estimated from discrepancies in data captured in national documents. Ultimately, “the most widely referenced models estimating the scale of IFFs are shaped by the availability of statistics and, consequently, largely fail to account for IFFs beyond trade mispricing and capital flight” (Hunter 2018: 14).
The focus on economic data poses a high risk of understating the proceeds of crime and corruption in global IFFs. Hunter (2018: 14-14) has criticised the allocation of small percentages to corruption and crime IFFs without a comprehensive methodology or analysis based on credit data and information, creating a narrative with the tendency to dismiss crime and corruption-related IFFs.
To measure crime and corruption, perception indices or investigation/conviction rates or surveys can be used. For instance, the OECD and Stolen Asset Recovery Initiative (StAR) launched a survey measuring assets frozen and returned between 2010 and June 2012 (OECD 2014: 88). In this time period, a total of approximately US$1.4 billion of corruption-related assets had been frozen, with a total of US$147 million returned to a foreign jurisdiction in the 2010-June 2012 period. These figures could be used to calculate corruption-related IFFs. However, the accuracy of the data collected may be questionable as some countries do not have a system for the systematic collection of data on international asset recovery cases (OECD 2014).
When measuring IFFs from criminal activities, money laundering is mainly used as a proxy. One of the main methods used, the multiple indicators, multiple causes (MIMIC) approach, measures various causes for money laundering (such as criminal activities, regulations and taxation) and indicators (such as confiscated money, prosecuted persons, growing demand for money, less official growth, and/or increases in crime rates) to get an estimate of the volume of money laundering (Hunter 2018: 13). Buehn and Schneider (2013) used the MIMIC method to estimate the volume of assets laundered and its time series trajectory between 1995 and 2006 for 20 OECD countries to conclude that money laundering from transnational organised crime increased from US$273 billion in 1995 to US$603 billion in 2006. However, the method lacks adequate data on criminal activity and there is a wide margin of error of +/−20.0% (Hunter 2018: 18).
Crime-based models, which estimate the scale of crime IFFs by limiting investigation and estimation to a crime type on geographic region or case study (Hunter 2018: 20), may be used to calculate corruption-related IFFs. For instance, the World Bank study “Ill-gotten Money and the Economy: Experiences from Malawi and Namibia” attempted to estimate the economic magnitude of ill-gotten money generated by different kinds of criminal activities in Malawi and Namibia (Yikona et al. 2011). The study relied on various sources, such as available crime statistics, suspicious transactions reports, a literature review, anecdotal information and perceptions of various experts in both countries. According to the report, the cost of corruption in Malawi was about 5% of the country’s GDP, with the most significant corruption cases over the past decade totalling US$44 million (Yikona et al. 2011: 30-33). For Namibia, it was concluded that the financial magnitude of government corruption was a larger problem than other forms of crime, with some individual cases involving up to US$14 million (Yikona et al. 2011: 60-61).
The challenge of using data from investigations, suspicious transaction reports, prosecution, conviction or surveys for corruption and crime-related IFFs is the large error margins (UNODC 2011: 50). Thus, it is unclear to what extent these case studies are representative of global flows (Hunter 2018: 22).
Overall challenges of using datasets of licit financial movement to calculate IFFs
A major challenge in estimating IFFs from licit financial movements is the lack of access to data, mainly due to sensitivity and confidentiality issues. According to the report of the second expert meeting on the statistical measurement of illicit financial flows, an exercise to estimate IFFs in South Africa showed that data from many government agencies exists even at the level of the individual transactions but it is almost impossible to gain access due to sensitivity and confidentiality issues (UNCTAD 2018a: 4). This may also apply to private and public financial institutions who may refuse access to data due to privacy or data protection measures.
Moreover, an absence of a universal methodology to monitor IFFs is believed to limit policy interventions and impair opportunities to tackle the challenge (UNCTAD 2018a). Nonetheless, there are currently projects researching the various methodological approaches to measure IFFs such as the one being undertaken by UNCTAD and ECA, with the cooperation of UNODC and ECLAC which seeks to define, estimate and disseminate statistics on IFFs in Africa (UNCTAD 2018b). The project aims to gain knowledge on the size of IFFs and their roots, provide evidence for a targeted and effective policy response, as well as improve the participating countries’ ability to measure IFFs over time, and monitor the impact of policies put in place to reduce these flows (UNCTAD 2018b). This includes the SDG indicator 16.4.1 which will provide methodology and estimations of each source of IFF using qualitative and quantitative data sources (UNODC/UNCTAD 2018).
As pointed out throughout the paper, the reliability of data used is a huge concern. The accuracy and reliability of major datasets such as UN Comtrade, DOTS and BOPs have been questioned, compromising IFF estimations relying on the datasets. Many current methods to measure IFFs are not feasible in developing countries due to the lack of comprehensive data (Hunter 2018: 13). IFF estimations are subject to exaggeration by weak institutional frameworks mostly in developing countries, such as the lack of regulations that require the disclosure of cross-border assets (UNCTAD 2018a: 5). This means that the estimates may be much higher or lower than the actual IFFs from the country. Ultimately, “most methods produce a constructed estimate, which will deviate from the true estimate by an error term of unknown size and direction” (Collin 2015: 50).
- The researchers devised an interactive map which shows countries attracting and losing profits. The map covers 86 countries that constitute 92% of global economic activity and more than 70% of the world’s population: https://missingprofits.world/