Query
Please empirically assess the impact of selected anti-corruption measures on economic growth.
Caveat
The Helpdesk Answer makes some effort to assess the quality and robustness of the reviewed studies. However, given the complexity of the models, determining the validity of methodologies and the credibility of certain findings would require a detailed examination of each study by an econometrist.
There are many types of anti-corruption measures, from the founding of anti-corruption agencies to the establishment of whistleblowing channels. Each of these can have disparate effects on economic growth. This paper considers three measures: promoting integrity in public contracting and concessions, foreign bribery legislation and fiscal transparency. These measures were selected for their broad analytical scope and evidence that captures a range of indicators of economic growth across different country income levels and on the macro and microeconomic scales.
This question, of whether a given anti-corruption measure has an effect on economic growth, can have an attribution problem. For example, a particular study might find the economic impact of enforcement actions related to foreign bribery legislation to be negligible. This could either be because enforcing foreign bribery makes no material difference to economic growth or because the enforcement actions are poorly designed or implemented and therefore have no effect in reducing foreign bribery. Many studies implicitly assume that the measures they examine have been effectively applied.
Conceptual framework
Corruption is widely recognised as a major impediment to economic development (see Gründler and Potrafke 2019; Mo 2001). Partly as a means to address these economic effects – as well as for a range of political considerations – governments and international organisations have implemented a range of anti-corruption measures aimed at reducing both the opportunities and incentives for corrupt behaviour. Much of the academic literature has primarily focused on the economic impact of corruption itself, such as its effect on the rate of growth of gross domestic product (GDP) (Mustapha 2014), investment (Habib and Zurawicki 2001) and public spending (Delavallade 2006). Less scholarly attention has been paid to the economic impact of anti-corruption measures themselves. However, a growing body of evidence explores how such measures can have a significant economic impact.
This Helpdesk Answer explores studies concerning integrity in public contracting and concessions, foreign bribery legislation and fiscal transparency in relation to their impact on economic growth, alongside empirical evaluations of their effectiveness in different institutional and economic contexts. Where studies do not provide them, country-income levels are drawn from World Bank (n.d.) classifications.
Indicators of economic growth
The following indicators were identified in the literature as being used by academics to document the economic effects of the three selected anti-corruption measures:
- Employment and labour indicators: employment indicators – for example, total factor productivity (TFP) – measure changes in job creation, employment rates and workforce growth. They can be referred to by those examining evidence showing the labour market effects of anti-corruption reforms.
- Firm performance: these indicators measure how well individual firms are performing, measuring things such as productivity, profits, sales, employment growth or firm value (market capitalisation).
- GDP growth: GDP growth is primarily measured through real GDP per capita or the overall GDP growth rate, and influenced by changes in, for example, national income levels or institutional quality.
- Government spending, revenue and fiscal indicators: these track how much the government spends and collects (revenues), often as a share of GDP. They can be used to ascertain if fiscal operations improve after implementing anti-corruption measures.
- Investment indicators: in the literature, investment indicators include foreign direct investment (FDI) outflows or inflows and firm capital expenditure. These indicators reflect the levels of capital entering an economy or business. Higher investment levels often signal confidence in economies and future growth potential.
- Other: other proxies identified in the literature include things like night-time light emissions (a sign of local economic activity), human capital investment and tax compliance.
Key methodological phrases
- Causal analysis: where a change in one variable directly produces a change in another.
- Correlational analysis: identifies associations between variables without implying causality.
- Difference-in-differences: a key causal method employed in the reviewed literature that compares changes in outcomes over time between a treatment- and control group.
- Governance indicators: the studies reviewed variously employ Transparency International’s Corruption Perceptions Index (CPI), the World Bank’s Control of Corruption Index (CCI), Public Administration Corruption Index (PACI), Open Budget Index (OBI) and World Development Indicators (WDI). These represent composite or individual measures of institutional quality, transparency, corruption levels and governance effectiveness across different jurisdictions.
- Parallel assumptions: a core function of difference-in-differences analyses, where, in the absence of treatment, the treated and control groups would have followed similar outcome trends over time.
- Propensity score matching: a method that attempts to balance treatment groups on confounding factors – which affect both the treatment assignment and the outcome – to gauge causal impacts.
- Regression analysis: a key method employed in the reviewed literature – typically applied by those seeking to document correlations – that estimates the relationship between a dependent variable and one or more independent variables.
- Robustness checks: for studies attempting to establish causality, robustness checks are used to assess the validity of results under different assumptions or specifications (e.g., placebo tests, sensitivity checks).
- Synthetic control method: a key causal method employed in the reviewed literature that constructs a synthetic control group by combining data from multiple untreated units to closely resemble the treated unit before intervention.
- Valuation model: a key method employed in the reviewed literature that is used to quantify the economic impact or value of a policy or institutional change – for example, a cost-benefit analysis.
Integrity in public contracting and concessions
Public contracting and concessions, often known as public procurement, is the government’s use of public funds to obtain goods and services. A core principle of public procurement is value for money, which can manifest in improved welfare and sustained economic growth (Aigheyisi and Edore 2015; Brianzoni et al. 2011). Many studies explore how strong governance in procurement is crucial for achieving political, economic and social goals (see Aigheyisi and Edore 2015; Ambe 2019), highlighting its role as an important lever of economic development across country income levels (see Becker et al. 2019; Catindin and Arnado 2024; Chan and Owusu 2022). On average, public procurement accounts for approximately 13% of GDP in low-income countries (LICs), 13.2% in middle-income countries (MICs) and 14% in high-income countries (HICs)(Bosio and Djankov 2020).
Estimates from the early 2000s by international development practitioners suggested that corruption could account for losses of around 10% to 15% of public procurement spending (Wathne and Stephenson 2021). While the precise amount is unknown,there is widespread consensus that, globally, huge sums are lost to corrupt practices during procurement processes. This loss is both direct – through price fixing, bid rigging and kickbacks that siphon funds away from public goods (UNODC 2013) – and indirect, as inefficiencies and maladministration in procurement processes reduce GDP (Campbell 2013), distort resource allocation and capital accumulation (Del Monte and Papagni 2001) or reduce investment in research, development and innovation (Edler et al. 2005). This issue has prompted a growing body of empirical and conceptual research to examine whether and to what extent enhancing integrity in public procurement can mitigate corruption and, in turn, contribute to economic growth.
Integrity in public contracting and concessions and economic performance
A review of the literature has revealed two key approaches for enhancing integrity in public contracting and potentially bolstering economic growth across high, middle and low-income economies. These are i) open contracting, a process that emphasises transparency and accessibility of procurement data; and ii) competitive procurement, which focuses on curbing non-competitive practices including corruption to foster fair and efficient market participation.
Open contracting
The Open Data Institute (2024: 11) suggests the term open contracting is fundamentally about “transparency of information… [and] the range and level of detail about procurement activities published openly”. Most notably, in HICs and MICs, this often takes the form of e-procurement reforms or the establishment of e‑procurement mechanisms in existing procurement structures (see Becker et al. 2019; Emery et al. 2023). Emery et al. (2023) contend that e-procurement can generate increased equality in access to economic opportunities such as more competition, reduced prices and better quality goods and services. Shakya (2024) emphasises e-procurement’s impact on spurring local economic development, increasing business for the private sector, saving governments time and money, and deterring fraud and corruption.
Studies have attempted to establish a causal link on this front. For example, the European Commission estimates that public institutions that use e-procurement systems have 5% to 20% savings on an annual basis compared to costs in periods before the adoption of these systems (Bradić-Martinović 2016). This view is supported by evidence from the Open Data Institute (2024), which found that after governments began publishing procurement data online, procurement systems achieved significant savings: a study by the Chilean Government revealed a reduction in operational costs of 28%, with expected future savings of 38%. Additionally, Kaspar and Puddephat (2012) highlight that e-procurement reforms in Chile and New Zealand have significantly reduced the overall cost of obtaining information on contracts and have improved firm efficiency.
Other studies go further to assess the empirical impact of e-procurement reforms in HICs on macroeconomic growth in different institutional contexts. For example, Emery et al. (2023) use a synthetic control method to estimate the causal impact of e‑procurement reforms in Western Australia and New South Wales on real per capita GDP over time. By matching pre-reform growth trends and institutional, geographic, legal and demographic features of the two states and a synthetic control group of sample locations, they isolate the growth effects of e-procurement. The results highlight that implementing clear and well-regulated e-procurement reforms contributed to a temporary increase in GDP per capita – a growth indicator, however, that is dependent on the presence of good governance standards. In Western Australia, reforms led to a growth in GDP per capita whereas, in New South Wales, the existence of weak oversight and corruption risks distorted growth outcomes. While the authors conduct a series of robustness checks to strengthen causal claims, they note a reliance on context-specific data and potential exogenous economic changes may reflect limitations in their empirical conclusions.
The above finding is reinforced by two studies by Mélon and Spruk (2019; 2020), who also employ a synthetic control method to measure selected jurisdictions against a sample of control group countries to show that, while e-procurement is an effective policy, it may have counterproductive effects if implemented in contexts with potentially corrupt governance, such as entrenching existing corrupt practices, increasing rent-seeking and reducing regulatory quality. Both studies use Kaufman et al.’s (2011) governance indicators0c1e503e95cd as their dependent variables for institutional quality. Mélon and Spruk’s 2020 study finds that e-procurement reforms enacted in the Netherlands and Denmark resulted in increased institutional quality, which the authors associate with increased levels of per capita income and human capital investment. However, they found that reforms in Portugal had the adverse effect as they ultimately reinforced existing patterns of corruption and regulatory weakness byfostering nepotism and favouritism among those able to exploit the emerging digital system(Mélon and Spruk 2020).
Box 1: Ukraine’s Prozorro
One notable success story is Ukraine’s e-procurement platform, Prozorro. Co-created by civil-society, government and business, it is a hybrid public-private electronic open-source system that publishes open, accessible data and contract information (Kelman and Yukins 2022).
The OECD (2021) notes that, prior to reforms, the Ukrainian government lost up to 10% to 15% of annual government expenditure or UAH35 billion (approx. US$1.3 billion) to UAH52.5 billion (approx. US$1.8 billion) to procurement corruption and rigged tenders. The introduction of Ukraine’s open-bid, open-access system and mandatory government participation has yielded approximately US$9.8 billion (approx. US$360 million) of savings since its inception (Prozorro 2024). Additionally, the volume of competitive procurement in Ukraine increased from UAH 616.8 billion in 2023 to UAH841 billion in 2024 with the total value of contracts increasing five-fold (Prozorro 2025).74a144152855
The World Bank (2018) found the implementation of Prozorro to be a key driver of Ukraine’s improved e-government index score. Ivanova (2023), citing Prozorro as an example of digital reform, uses multiple regression analysis of official secondary datasets and macroeconomic indicators to examine how improvements in the e‑government index correlate with economic outcomes, finding that a 1% increase in the e-government index correlates with a 0.2% GDP rise.
In their earlier study, Mélon and Spruk (2019) examined how e-procurement reform influenced long-term economic growth and development in Singapore. Using a synthetic control method, matching Singapore on pre-policy growth and development characteristics with a control sample of 100 countries, they found “large and pervasive growth gains from [the implementation of] e-procurement” (Mélon and Spruk 2019:1). They note that the gap of per capita income widens relative to sample jurisdictions, placing Singapore's per capita income 1.03 times higher than its measured counterparts, indicating large-scale growth benefits over time. Evidence from both studies (see Mélon and Spruk 2019; 2020) emphasise that the estimated impact of reform is robust and statistically significant across a number of specification checks and sensitivity analyses. They note, however, their evidence is largely context dependent, with the impact of e-procurement reforms shaped primarily by the extent of institutional quality before the introduction of reforms.
E-procurement is also a common reform measure in middle-income economies and implementation and has had similar effects on economic growth. For example, Catindin and Arnado (2024) provide evidence that transparency in public procurement significantly boost local economic development in the Caraga Region of the Philippines. Using survey data from suppliers and applying regression analysis, they find that transparency reforms in public procurement have strong correlations with improved economic and social well-being in the region. Survey responses note an increase in supply, demand, competition, employment opportunity and, in turn, firm performance, which demonstrates how transparent engagement between suppliers and public departments can drive local economic growth (Catindin and Arnado 2024).
Competitive procurement
Alongside open contracting, many studies point to the significance of competition and fairness as a symptom of good practice in the procurement process (see Aigheyisi and Edore 2015; Ambe 2019; Catindin and Arnado 2024; Chan and Owusu 2022; Mukobi 2024).034f1eb198f8 Increased levels of competition not only drive suppliers to offer optimal quality goods and services to win contracts but may also act as a safeguard against corruption by breaking up monopolies and reducing discretion in the award of contracts (Hunja 2003). British government estimates indicate that somewhere between £4billion to £7.7 billion (approx. US$5.5 billion to US$10.7 billion) could be saved every year if optimal competition were applied to the procurement process (House of Commons Committee of Public Accounts 2023). Similarly, reforms promoting competition in procurement in the US resulted in savings of up to US$470 million over four years, with goods and services purchased through these reforms costing, on average, 25% less than under previous procurement methods(Dinapoli et al. 2016). Finally, the European Commission (2011a: 3) notes that “measurable savings” were recorded following reforms in the EU and estimate that public procurement directives generated savings of approximately 5% on contracts worth around €420 billion annually, equivalent to roughly €20 billion per year (European Commission 2011b).
A growing body of literature has empirically assessed the relationship between economic growth and pro-competition reforms in low and middle-income countries. For example, Fazekas et al. (2025) provide strong micro-level evidence that competitive public procurement boosts firm growth in Bulgaria. The study compares firms’ yearly performance indicators (TFP, labour productivity, intangible assets and profits) using propensity score matching and difference-in-differences, to isolate the impact of political favouritism in procurement on firm performance and growth. They estimate that firms winning uncompetitive tenders and thereby securing contracts due to political connections perform worse than their counterparts that win contracts competitively (Fazekas et al. 2025).8e01189c9fce However, while politically connected firms experience reduced productivity and employment growth, they have greater profit margins, suggesting they are able to extract rents from the government.
On a wider level, Bosio et al. (2023) review the before and after cost-benefits of competitive procurement reforms across 11 low and middle-income countries. By collecting and comparing – from the relevant literature – real-world procurement price data before and after reforms and calculating the average reduction in procurement prices, they estimate total government spending savings of up to US$637.9 million across the sample of LICs and US$5.2 billion across the sample of MICs (Bosio et al. 2023). They present their findings as follows:
Table 1: Reduction in procurement prices following competitive procurement reforms
|
Country |
% Reduction in procurement prices |
|
Argentina |
4% |
|
Bangladesh |
7% |
|
Brazil (São Paulo) |
25% |
|
Chile |
3% |
|
India (Andhra Pradesh) |
8% |
|
India (Bangalore) |
4% to 12% |
|
Mauritius |
20% |
|
Mexico |
5% to 25% |
|
Philippines |
10% to 25% |
|
South Korea |
12.5% |
|
Ukraine |
3.5% to 5.8% |
Source: Bosio et al. (2023: 89).
It is important to note that reduced government spending does not necessarily contribute to economic growth (see Fournier and Johansson 2016). However, as Vogel (2009) notes, if these cost savings are used in productive ways, such as to increase public investment in other areas, this can potentially have positive knock-on economic effects such as higher total GDP growth and employment levels. In addition, open and competitive public contracting can reduce the risk that funds allocated by the state to fund the acquisition of specific goods and services are siphoned off by corrupt actors. As such, this makes it more likely that the full budget allocated to acquire those goods and services is actually used as intended and can thus potentially increase the positive economic impact of those public investments.
Summary of findings
The evidence has shown that integrity enhancing reforms in public contracting and concessions create both firm-level and macro-level benefits, though effects vary across income levels and institutional contexts.
At the firm level, such reforms have been seen to boost productivity and employment (Catindin and Arnado 2024; Fazekas et al. 2025), particularly in jurisdictions with high institutional quality.
At the macro level, procurement reforms are associated with fiscal savings (Open Data Institute 2024) more efficient public spending (Bosio et al. 2023) and, in some cases, GDP growth (Emery et al. 2023; Ivanova 2023). However, the ultimate economic impact of these reforms is highly dependent on the institutional environment: robust gains in economic performance are most apparent where governance standards are already strong (Emery et al. 2023; Mélon and Spruk 2019 2020), while weak oversight can in some instances lead to digitalisation reforms to further entrench corrupt practices (Mélon and Spruk 2020).
Foreign bribery legislation
A growing body of literature explores how foreign bribery affects economic growth (see Sanyal 2005; Jung and Lee 2023). Further studies identify a range of negative impacts that foreign bribery has on other markers of economic performance including lower levels of FDI (Blundell-Wignall and Roulet 2017; Christensen et al. 2022; Crippa 2023), poor market efficiency (van der Elst 2019) or reduced firm productivity (Goldman and Zeume 2024).5945fcfdbb50
The US Foreign Corrupt Practices Act (FCPA), the OECD Anti-Bribery Convention and the UK Bribery Act 2010 (UKBA) are the instruments most commonly studied by scholars examining the link between the existence and enforcement of foreign bribery legislation and economic growth, investment patterns and firm-level indicators.
US Foreign Corrupt Practices Act
Introduced in 1977, the FCPA was the first piece of legislation to criminalise and regulate foreign bribery (Christensen et al. 2022). The FCPA has placed significant restrictions on opportunities for bribery in international markets, prompting a growing body of empirical research to study its effects on foreign investment, firm behaviour, and other relevant economic indicators in both the US and other jurisdictions.
US Foreign Corrupt Practices Act and economic performance
Christensen et al. (2020) use a difference-in-differences approach to analyse local economic development in African resource extraction sites following the 2005 surge in FCPA enforcement. Using night-time light emissions as a proxy for economic activity, they find that areas with an extraction facility subject to FCPA enforcement saw growth in economic activity over time. They find up to a 14% increase in luminosity within 10 kilometres of regulated sites, and an increase of up to 8% within a 50 kilometre radius. Notably, countries most prone to corruption in the extractive industries sector prior to increased FCPA enforcement experienced proportionately higher levels of economic activity after the increase in enforcement than countries with a lower incidence of corruption. In other words, FCPA enforcement had the largest (positive) effect on the local economy in settings with the highest rate of corruption, presumably because in these contexts corruption had been a more substantial barrier to local economic growth.
The authors also report a reduction in perceived corruption among local officials, suggesting that greater FCPA enforcement encouraged more transparent and responsible business practices. The evidence supports a causal relationship between active FCPA enforcement and higher rates of local economic development, especially in high-corruption settings. This findingholds up in robustness tests: treated sites and control sites have parallel pre-trends, no effects are found in placebo samples and estimates remain unchanged when controlling for electricity access, population and several specifications of an alternate model.
Similarly, Christensen et al. (2022) again use a difference-in-differences approach leveraging the 2005 FCPA enforcement surge to compare changes across a range of industries in bilateral FDI flows and firm-level capital expenditure in countries with a high risk of corruption, between OECD and non-OECD countries, and between those firms that were subject to FCPA enforcement and those firms that were not. The difference-in-differences design satisfies the referenced parallel trends assumption where “OECD countries have similar patterns in FDI flows to [non OECD] high- and low-corruption-risk countries before 2005” (Christensen et al. 2022: 20) and at the firm level where “the coefficient estimates are close to zero and statistically insignificant”(Christensen et al. 2022: 27) before 2005. The results are robust to multiple sensitivity checks. There are two key findings:
- Impact on bilateral FDI flows: Christensen et al. (2022) find that the mid-2000s spike in FCPA enforcement caused a 2.9% drop in FDI from OECD countries to corruption-prone destinations. They highlight that this reduction in investment occurred for both the US and other OECD countries, and non-OECD countries did not increase investment to fill this gap.
- Firm-level investment: in countries with a high risk of corruption, firms in non-OECD countries subject to FCPA enforcement reduced capital expenditure by approximately 16% more than companies not subject to FCPA enforcement (Christensen et al. 2022).
Jia et al. (2022) examine how FCPA enforcement affects FDI flows at the country level. Harnessing legal data from the US Securities and Exchange Commission and the US Department of Justice, they use 3,524 country-year observations and a difference-in-differences approach to compare changes in growth of US FDI inflows before and after an initial FCPA enforcement action in each regulated jurisdiction. Confirming the validity of their parallel trends assumption (where investment levels for both categories of firms followed similar trends), their analysis reveals that, on average, US FDI growth rate in a host country declines by about 5% following the first FCPA enforcement action when compared to jurisdictions not implicated in an FCPA enforcement action. They note that the effect is greater in countries with a weak rule of law, suggesting that US firms are particularly deterred from investing where institutional environments are more prone to corruption.
Goldman and Zeume (2024) empirically assess effects at the firm-level in non-OECD countries. They employ difference-in-differences techniques to demonstrate that firms that are subject to FCPA regulation but are not the object of FCPA enforcement actions perform better commercially than firms operating in the same country and industry that are penalised for FCPA infringements. Those firms that have not been penalised for FCPA infringements experience substantial increases in revenue (6.9%), asset productivity (5.6%) and profitability relative to their penalised competitors who operate in the same markets. This effect is especially pronounced in sectors with high government contracting intensity. Both Jia et al. (2022) and Goldman and Zeume (2024) find their results to be robust to alternative model specifications.
In a more recent study, Ghosh Dastidar and Yano (2025) use a theoretical modelling approach to document the effects of FCPA enforcement on “market quality” as a composite indicatorbcc491ed5f7b in emerging economies. The model compares two firms operating within the same emerging economy – i) a US firm subject to FCPA regulation and ii) a local firm exempt from it – to measure changes in firm behaviour, output, and “market quality” in response to FCPA enforcement. The authors argue that while increasing the size of FCPA penalties (the monetary value of the fine imposed) reduces overall corruption by deterring the US firm from paying bribes, it can also lead to a deterioration in “market quality”. This occurs because reduced bribery raises the US firm’s costs as a result of greater “regulatory hurdles” that these firms have since been now forced to navigate whereas previously they would have circumvented these barriers through the payment of a bribe. The authors contend that this can cause to US firms to exit the market, leading to lower output, decreased total market surplus and thus lower “market quality” (Ghosh Dastidar and Yano 2025: 9).
According to their model, stricter FCPA enforcement can generate complex effects depending on whether a market is characterised by goods produced by US firms vis-à-visgoods produced by local firms being interchangeable or complementary.788dec6fdb9f The model suggests that in markets with interchangeable goods, the exit of US firms as a result of more stringent FCPA enforcement would lead to an increase in overall corruption as local firms are more prepared to bribe local officials when navigating regulatory hurdles. However, the greater market share of local firms results in total output and consumer surplus both increasing enough to outweigh the costs of increased bribery. When goods are complementary, however, stricter enforcement leading to US firms exiting the market sees both reduced corruption and “market quality” as overall output falls (Ghosh Dastidar and Yano 2025). This is because, in markets characterised by interchangeable goods, local firms can increase their output as the US firm withdraws, whereas in markets with complementary goods, output tends to fall for both firms when one withdraws.
Crippa et al. (2025) analyse market valuations of publicly traded firms in the wake of President Trump’s February 2025 executive orders and the suspension of FCPA enforcement. They examine 261 firms previously penalised or investigated under the FCPA and compare their share prices with the broader market, and firms with no prior enforcement or investigation history. Their findings reveal that, immediately following the executive order halting FCPA enforcement, firms previously penalised or investigated under the FCPA experienced significant gains in stock price, averaging 0.69 percentage points above expected market returns, with an average market capitalisation increase of US$160 million per firm. The suspension of FCPA enforcement sharply increased investment in such firms. Crippa et al. (2025) emphasise that investors interpreted Trump’s halt to FCPA enforcement as a sudden reduction in investment risk in companies with a history of engaging in corrupt behaviour, and stress that this underscores the deterrent effect FCPA enforcement previously had. They find their results to be robust to several tests.
OECD Anti-Bribery Convention
The OECD Anti-Bribery Convention, introduced in 1999, operates as a legally binding international instrument targeting the “supply side” of foreign bribery. The convention criminalises transnational bribery of foreign public officials and obliges signatories to enforce penalties and safeguard publicly funded projects from corruption.
OECD Anti-Bribery Convention and economic growth
Parties to the convention account for 64% of global FDI flows, underscoring its global economic influence (Blundell-Wignall and Roulet 2017). A growing body of literature seeks to assess whether commitments to the convention, and their implementation, have yielded measurable effects on economic growth, most notably on FDI.
For example, using advanced data techniques and analysing dynamic panel data from 54 countries3c5b2633bba2 over 15 years, Blundell-Wignall and Roulet (2017) employ a bilateral FDI gravity model to demonstrate that ratification of the OECD Anti-Bribery Convention leads to a significant decline in FDI to corruption-prone countries. Their analysis controls for persistence in FDI, institutional quality and endogeneity, lending robustness to the findings. At the country level, while the overall relationship between corruption and FDI inflows is generally positive, consistent with the theory that corruption may facilitate business entry in difficult environments, the authors find that this effect diminishes substantially, and in some cases reverses, when the source (investing) country ratifies the convention. For FDI destination countries, just a one-point increase in perceived corruption (using Transparency International’s CPI) reduces measured investment by firms from OECD convention signatory countries by around 40%, or causes FDI outflows by such firms to fall by 4% to 9% (using CPI and the World Bank CCI).
D’Souza (2012) uses export and import panel data and a gravity model with fixed effects to highlight that convention signatory states see a 5.6% average decline in bilateral exports to high-corruption importers relative to low-corruption countries. This implies that by raising the cost of engaging in bribery, the convention effectively increased transaction costs between importers based in high-corruption countries and exporters in countries that criminalised foreign bribery, inducing some firms to reduce exports and others to exit the markets. The results control for differences between variables, and findings are robust to sensitivity checks.
Analysing firm-level data and employing a synthetic control method, Crippa (2023) evaluates whether, when a country ratifies the OECD Anti-Bribery Convention, this affects the outward investments by firms headquartered in that country and their propensity to invest in third countries (host countries), which are categorised by low/medium/high corruption (PACI score).d75d2d0f71e7 Using the Public Administration Corruption Index as the primary indicator for corruption levels, the author finds the effect to be non-linear (Crippa 2023):
Figure 1: The non-linear effect of ratifying the OECD convention on investment, relative to host-country corruption
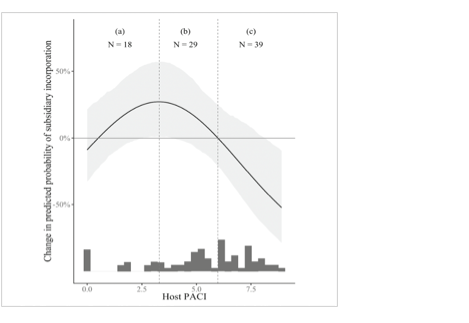
Source: Crippa (2023: 17)
Low-corruption countries: for low-corruption countries (a PACI score of approximately 0–3), the change in likelihood that a firm headquartered in a signatory (ratifying) country will invest compared to a firm from a non-signatory, ranges from 0% (or close to 0%: with jurisdictions such as Canada, Denmark, Sweden) to a maximum of 27% (with jurisdictions such as Singapore and Taiwan). Within the low corruption range (o-3 PACI score) for FDI host countries, the more corrupt an FDI host country is, the more likely it is that ratification of the OECD convention by a source country leads to an increase in investment into the host country by firms based in the source country. Crippa (2023) suggests that this occurs because in ‘clean’ economies, where bribe requests are essentially absent, anti-bribery laws neither impose additional costs nor offer firms any particular advantage, resulting in a neutral effect. However, as corruption rises slightly within this band, regulations allow firms to credibly resist bribe demands without losing access to opportunities, thereby reducing the informal costs of doing business and explaining the observed positive effect (up to 27%).
Medium-corruption countries: in the medium-corruption country range, as an FDI host country becomes more corrupt, the effect of a source country ratifying the OECD convention on the likelihood that firms from that country will invest in the FDI host country is still positive but decreases as corruption levels grow. This indicates that OECD anti-bribery legislation drives investment by regulated firms into economies such as Brazil, China, Indonesia, Italy, Mexico and the United Arab Emirates (Crippa 2023). The author conjectures that as host-country corruption rises further within this range, the value of bribe-related rents grows, reducing the relative advantage of being subject to regulation and leading the positive effect on investment likelihood to decline (Crippa 2023).
High-corruption countries: firms headquartered in countries that have ratified the OECD convention are less likely to invest in high-corruption countries than firms headquartered in countries that have not. This effect is inversely proportional: as corruption levels increase, the probability of investment decreases. Measured at its lowest, this figure is -52%, represented by countries such as Egypt, India, Kazakhstan, Nigeria, Russia or Vietnam (Crippa 2023). Crippa suggests this is because in such contexts, bribes are central to securing profitable rents and market access. Unregulated firms can pay and capture these opportunities, while regulated firms are constrained. This leaves regulated firms at a disadvantage compared to their unregulated competitors, reducing their probability of investing as corruption levels increase (Crippa 2023).
UK Bribery Act 2010
The UK Bribery Act (UKBA) was introduced to simplify and modernise outdated UK bribery laws and extend the UK’s anti-corruption enforcement internationally (Lagu Yanga 2014). The act covers businesses, their subsidiaries and supply chains with UK connections and creates an offence for failing to prevent bribery within such bodies. Given its scope and impact on global supply chains, researchers have sought to assess the UKBA’s impact on economic growth, with a primary focus on micro-level firm evidence.
UK Bribery Act 2010 and economic growth
Using a difference-in-differences design, Kim et al. (2020) estimate the UKBA’s impact on equity and implied growth rates across 1,022 firms listed on the London Stock Exchange. They do this for firms in two five-year periods before and after the UKBA came into force. The authors find the UKBA is associated with a reduction in the cost of equity – the return firms must offer investors to compensate for risk – including for firms with high and low-exposure to bribery (Kim et al. 2020). The authors note a reduction in the cost of equity reflects reduced perceived risk among investors, which can enable firms to raise capital at a lower required rate of return.They find the average reduction in the cost of equity for the total sample in the period before and after 2010 is 11.3% and 9.6% respectively, with firms exposed to high and low bribery risks seeing a reduction of 4% and 1.1% respectively. They note, however, that despite traditional assumptions about the overall negative effect on firm value on becoming subject to foreign bribery legislation – through for example, increased compliance costs– the UKBA improved internal control systems and stock liquidity. Overall, the UKBA reduced perceived investment risk among equity holders, robust to several checks.
Zeume (2013) provides additional evidence by exploiting the unexpected introduction of the UKBA on firms’ value and sales in regions perceived to be more corrupt. Using an event study approach, he examines 645 UK firms and 2,791 primarily European (and some Indian) firms, including those with and without UK subsidiaries, to compare their cumulative abnormal returns2150351ef25c shortly before and after the date of announcement. He finds that UK firms that are more closely linked to perceivably corrupt regions experienced a 0.48% reduction in value. In addition, the sales of firms subject to the UKBA stagnated at 0.4% the year following enforcement, while continental European firms’ sales grew by 6.4% in the same period.
Sanseverino (2022) provides empirical evidence of the UKBA’s extraterritorial application to US multinational firms. Using a difference-in-differences approach and a series of controls,c010318af3d3 the author compares US multinationals with material business in the UK to those with material business in other foreign jurisdictions. The author finds that given the UKBA increased public litigation costs associated with foreign bribery, US firms subject to the provisions of the UKBA curbed their business exposure to countries with a high risk of corruption, relative to those US companies that were not subject to the provisions of the UKBA. In sum, the UKBA raised the cost of foreign bribery, which led some firms to reduce their business exposure and investment to high-corruption risk countries, robust to several placebo checks.
Summary of findings
This body of evidence suggests that the economic effects of foreign bribery legislation operate differently at the macro and firm levels.
At the macro level, foreign bribery legislation alters investment flows by discouraging firms subject to regulation from engaging in business in environments with a high risk of corruption (Blundell-Wignall and Roulet 2017; Christensen et al. 2022; D’Souza 2012; Jia et al. 2022; Sanseverino 2022). Rather than being offset by investment from firms not subject to these rules (see Christensen et al. 2022), the evidence suggests that such capital is largely redirected towards jurisdictions with lower corruption risks (Crippa 2023). This may result in slower economic growth for countries that remain highly corrupt and reliant on foreign investment. At the same time, enforcing foreign bribery legislation can potentially have positive effects on a country’s economic development by reducing opportunities for corruption and thereby gradually reducing inefficiencies.
At the firm level, the relationship between foreign bribery legislation and economic performance is shaped by how enforcement or being subject to regulation alters the costs, risks and competitive position of different types of firms. Firms exposed to high-corruption markets may face increased compliance and litigation costs or have higher associated investment risks, which may lead to reduced capital expenditure, market withdrawal, reduction in value or slower sales growth (Christensen et al. 2022; Sanseverino 2022; Zeume 2013). Crippa et al. (2025) show that markets price in such risks, with previously penalised firms seeing positive abnormal returns after FCPA enforcement was suspended.
However, firms operating under the same foreign bribery regulatory environment that are not penalised for corrupt practices may experience higher revenue, productivity and profitability (Goldman and Zeume 2024), while stronger investor confidence – from reduced perceived corruption – can lower the cost of equity for firms subject to regulation (Kim et al. 2020).
Overall, the literature indicates that while foreign bribery legislation can impose costs on firms and reduce investment in high-corruption jurisdictions, it can also reshape market competition, reallocate capital towards lower-risk environments and improve investor confidence. Over the longer term, these shifts may contribute to higher aggregate growth and economic performance – though this effect is largely dependent on both institutional quality and perceived corruption levels.
Fiscal transparency
Fiscal transparency is widely understood as the openness, clarity and quality of a government’s financial activities and plays a crucial role in contributing to “less corruption, more efficient use of resources, more trust in government, and higher revenues” (De Renzio and Wehner 2017: 185). Its effects are pronounced across country-income levels, as evidenced by Pattanayak (2019):
Figure 2: Across country levels, on average, more transparent countries have better fiscal outcomes
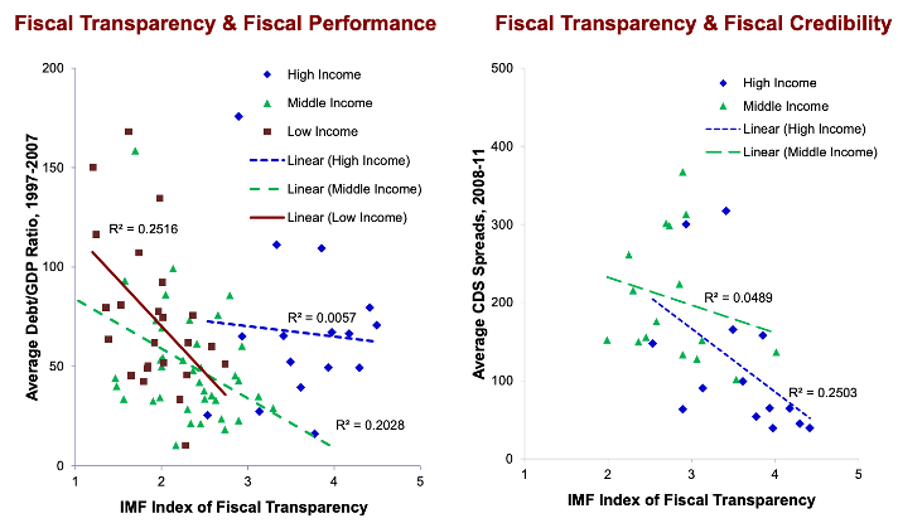
Source: Pattanayak (2019: 3)
On the IMF Fiscal Transparency Index, a score of 1 out of 5 indicates low fiscal transparency, while 5 indicates the highest level. Credit default swap (CDS) spreads represent the cost of buying insurance against a country (or another entity) defaulting on its debts. When CDS spreads are high, it means that the market views the country as a riskier investment.
An absence of fiscal transparency is associated with issues such as resource misallocation, reduced public trust and lower revenues, which in turn may negatively affect economic performance (De Renzio and Wehner 2017) through, for example, reduced GDP (Gerunov 2016), lower capital accumulation (Macek and Janků 2015) or diminished local fiscal revenue and expenditures (Liu and Chen 2024). As a result, there exists a growing body of literature that aims to empirically assess the impact of fiscal transparency on economic growth, at the macro and microeconomic scales.
Fiscal transparency and economic performance
Gerunov (2016) analyses the impact of fiscal openness on the level of public debt and budget deficits (all as percentage of GDP) across 57 countries over several years. The author uses the Open Budget Index (OBI) and IMF data to employ fixed effects panel regression models, controlling for a series of macroeconomic factors, to isolate the effect of transparency and provide correlational evidence. Gerunov (2016) finds that the relationship between fiscal openness on one hand and levels of public debt and budget deficits on the other depends on the income category to which a country belongs. Over the longer term, greater transparency is closely associated with lower levels of government debt for both high-income and low-income countries. Here, a gain of 10 points on the OBI index is associated with averaged reduced government debt of 5% to 7% of GDP. For middle-income countries, the impact of fiscal transparency on public debt and budget deficits is weak or absent, likely due to institutional quality (Gerunov 2016).
Under a similar framework, Fomina and Vynnychenko (2017) use the OBI to determine a correlational relationship between fiscal transparency and a range of macroeconomic indicators across a sample of 36 countries with varying levels of budget transparency and institutional development.c83641f67a2b Their findings corroborate those found in Gerunov’s (2016) study where greater fiscal transparency correlates with reduced public debt as a share of total GDP, with the effect varying across country income types. For high and middle-income economies, this effect is evident, while there is no significant correlation for low-income economies in the sample. Additionally, the authors find that higher levels of fiscal transparency lead to an increase in public expenditure and public revenues as a percentage of GDP, with a more consistent effect seen in countries with high economic freedom19b6b59566c3 and medium development.
Cicatiello et al. (2021) conduct an empirical cross-jurisdictional study to test the effects of fiscal transparency on FDI inflows, employing a panel regression analysis on data from 72 countries. The authors hypothesis that fiscal transparency attracts FDI, noting the availability and accessibility of fiscal information could be an attractive quality for foreign investors. Empirically, the authors find that fiscal transparency (measured by the OBI) is positive and significant with levels of FDI inflows (measured by WDI) illustrated by a one-point increase in OBI score resulting in a 0.92% increase in the net inflows of FDI.
When isolating the OBI score for budget execution, the effect is positive and significant at the conventional level of 1% such that an increase of one-point in budget execution score is associated with an increase of FDI inflow by 1.32% the following year, with the effect especially marked in non-OECD and low or lower-middle income countries. The authors note then that making government preferences explicit and increasing government commitment to fiscal evaluation are the primary mechanisms through which fiscal transparency attracts FDI. They find the positive effect to be robust to several different specifications.
Studies have also attempted to empirically assess firm-level economic growth as it relates to fiscal transparency reforms. For example, Hope et al. (2022) cross-reference fiscal transparency data using the HRV index73c4fb3d0061 (see Hollyer, Rosendorff and Vreeland 2014) with data on firm-level growth indicators from the World Bank Enterprise Survey. The authors find a positive causal effect of higher levels of government transparency on firm-level operational efficiency, noting that transparent economic information – such as public information about local economic and business conditions – assists firms’ economic decisions and improves capital providers’ ability to assess risks. The authors further disaggregate their findings, concluding the effect is weaker in countries with well-developed capital or credit markets, as economic information – including data on GDP growth, inflation, trade balances and government spending – is more routinely available and trusted from alternative sources, and for audited firms with reliable internal financial data and information. Findings are robust to differing measures and estimation methods, though there exists some potential for omitted-variable bias (Hope et al. 2022).
Using a natural experiment and synthetic control method, Liu and Chen (2024) examine the impact of fiscal transparency reforms in Jiaozuo, China, by comparing local fiscal revenues and expenditures between similar cities over the years 1984 to 2008. The study found that the reforms in Jiaozuo did not initially contribute to immediate improvements in local fiscal revenues and expenditures and actually declined as a result of poor economic conditions. Although Jiaozuo’s fiscal outcomes consistently remained below those of the synthetic control,a positive effect was seen over time with a gradual rise in per capita fiscal revenue and expenditures. They note that embedding fiscal transparency and standardised administrative mechanisms fosters a more self-reliant and effective market economy. This in turn, curbs rent seeking and improves business conduct in “less mature” economies. The authors find the results to be robust to placebo and sensitivity tests.
Thanh and Hiep (2025) empirically analyse fiscal transparency’s impact on local economic growth, specifically its effect on government spending in Vietnam at the provincial level. Using a robust spatio-temporal analytical approach and panel data from 63 Vietnamese provinces between 2012 and 2019, they consider three categories of local government expenditure among a series of economic growth indicators. They find that higher levels of fiscal transparency result in improved public resource allocation and effectiveness of public service delivery, by mitigating bias, heightening efficiency in financial operations and removing the need for unnecessary expenditure.
In this sense, provinces with higher levels of fiscal transparency experience more effective budget use, evidenced by improved public services and infrastructure. The authors note that local governments, in particular, are crucial to this development as, in contrast to central government, they maintain close relationships with the local population, which enables effective fiscal transparency measures to generate positive community engagement. The authors do, however, note that the effect is not experienced cohesively across all the provinces. They explain that levels of budget autonomy directly affect the implementation and hence effectiveness of transparency reforms. This difference is noted in north and south Vietnam, where southern provinces see more improved outcomes due to effective reform implementation, where the opposite tends to occur in north Vietnam.
The literature has also pointed towards the effectiveness of participatory budgeting, where local communities are consulted and engage in fiscal policy. The Open Government Partnership (2022) note that participatory budgeting initiates a cycle of good governance, with engaged citizens willing to pay more taxes as they feel involved in fiscal decision-making.
Figure 3: The cycle of participatory budgeting
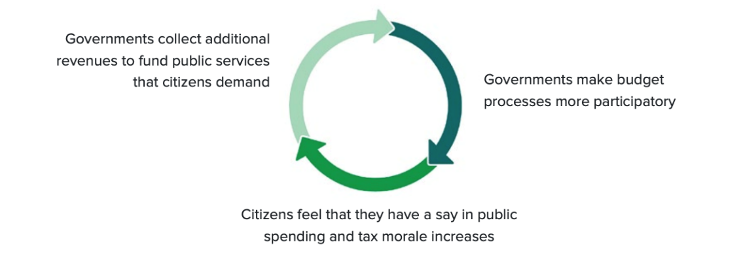
Source: Open Government Partnership (2022: 24)
Many studies have sought to empirically assess how participatory budgeting can improve economic development. In Brazil, for example, several municipalities implemented participatory budgeting reforms. As a result, municipalities collected 2.5% more tax revenue per additional policy council,d85228aa52c0 and an additional 16% when such councils adopted participatory budgeting, with the effect strengthening over time (Touchton and Wampler 2020). Weigel (2020) also identified a relationship between participatory budgeting and economic growth at the local level in the Democratic Republic of Congo. He conducted a field study across 356 neighbourhoods in a large Congolese city and investigated whether attempts to broaden the tax base in a fragile state could bolster greater political engagement and hence drive positive tax operations. The author found that in neighbourhoods where the policy was implemented, political participation increased by 5% and property tax compliance increased by 11.6%.
Summary of findings
Overall, the literature demonstrates that fiscal transparency can contribute to stronger economic performance by improving the allocation and efficiency of public resources, attracting investment and fostering trust between governments and citizens (De Renzio and Wehner 2017; Pattanayak 2019; Touchton and Wampler 2020).
At the macro level, greater transparency is generally associated with lower public debt and budget deficits as a share of GDP, particularly in high and some middle-income countries (Gerunov 2016; Fomina and Vynnychenko 2017) and can attract foreign investment, particularly in low and lower-middle income countries (Cicatiello et al. 2021).
At the micro-level, transparent provision of economic and fiscal data supports better firm-level decision-making, improves operational efficiency and can enhance market functioning, especially in “less mature” economies with weaker alternative information channels (Hope et al. 2022; Liu and Chen 2024). The overall growth effects of fiscal transparency are not uniform, varying with institutional quality, budget autonomy and the inclusiveness of governance mechanisms such as participatory budgeting, which can strengthen public trust and increase tax compliance (Thanh and Hiep 2025; Touchton and Wampler 2020; Weigel 2020).
- These indicators include “the control of corruption, rule of law, government effectiveness and regulatory quality… [noted] as the institutional outcomes most likely to be affected by the introduction of e‑procurement” (Mélon and Spruk, 2020: 12).
- While this is partly explored above, the literature tends to analyse competition and e-procurement separately when approached from an economic perspective.
- For example, firms that engage in competitive procurement saw a 17.2% increase in TFP and higher productivity growth.
- While some studies (e.g., Christensen et al, 2020) focus on low or middle-income country contexts, and others distinguish between OECD and non-OECD jurisdictions, none provide explicit systematic disaggregation of evidence by host-country income level.
- In their framework, market quality is defined as total social surplus (including consumer surplus, local firm profits and bribes received by officials) minus the total amount of bribes paid (the “corruption index”).
- Here, “interchangeable” refers to goods that can easily replace each other; “complementary” are goods typically dependent on one another and used together.
- These include a mix of HICs, MICs and LICs, and covers the 41 countries party to the OECD Anti-Bribery Convention plus major emerging economies and G20 countries for which FDI outflow data are available.
- This approach compares firms headquartered in countries that have ratified the convention to those companies based in countries that have not ratified the convention in terms of how likely they are to invest in a third party FDI host country, across different levels of host country corruption (PACI score). The percentage values indicate how much more or less likely regulated firms (headquartered in ratified countries) are to invest in a host country compared to firms headquartered in a country that has not ratified the OECD convention at each corruption level. Several robustness checks were conducted and extensive controls used to support the causal validity of the evidence.
- Abnormal returns are the amount by which a stock’s actual return differs from what would be expected based on a benchmark or model.
- These are firm size, profitability, growth, number of geographic segments/subsidiaries, competitiveness, industry-year, country-year and region-year fixed effects.
- Government revenue in GDP grows by 0.077% with an increase in Open Budget Index value per unit.
- These include: 1) the level of transparency of the budget; 2) the level of income per capita; 3) the stage of economic development; 4) the level of economic freedom
- The HRV Index measures government transparency based on the extent of economic data a country reports to the World Bank’s WDI.
- Policy councils are public forums where citizens, civil society, and government officials jointly shape and oversee public policy.
- Sources note that the sustained success of this platform is owed, in part, to DoZorro, a platform that allows citizens, journalists and civil society organisations to review and flag tenders and contracts for irregularities (Kelman and Yukins, 2022).