Query
Please provide an overview of existing estimates on corruption-related revenue losses in the forestry sector and oversight mechanisms to address corruption risks.
Background
According to recent estimates, 31% of the Earth’s land surface is covered by forest, with the largest share located in the tropical regions.7d5f8a78de8b The vast majority (93%) of these forests are naturally regenerating, while the remainder consists of planted forests, though this balance is shifting as natural forests continue to be destroyed (UNODC 2023: 6). Nearly one-fifth (18%) of global forest area lies within protected areas, with South America having the highest proportion of protected forests worldwide (UNODC 2023: 6).
Forest loss41982bbc550e has historically been severe (FAO and UNEP 2020; FAO 2020) (Figure 1). Approximately 10% of the world’s total remaining forests disappeared between 1990 and 2020 (UNODC 2023: 7). Particularly alarming is the degradation of tropical primary forests, which generate most benefits to the environment. This process has been especially pronounced in three countries: between 2002 and 2014, an estimated 28% to 30% of Brazil’s primary forests were degraded, compared with 40% to 41% in the Democratic Republic of the Congo and 63% to 66% in Indonesia (UNODC 2023: 9; Turubanova et al. 2018: 10). According to the Global Forest Watch (2024), Indonesia lost 20% of its 2000 tree-cover area between 2001 and 2024.
Figure 1: Annual forest area net change, 1990-2020.
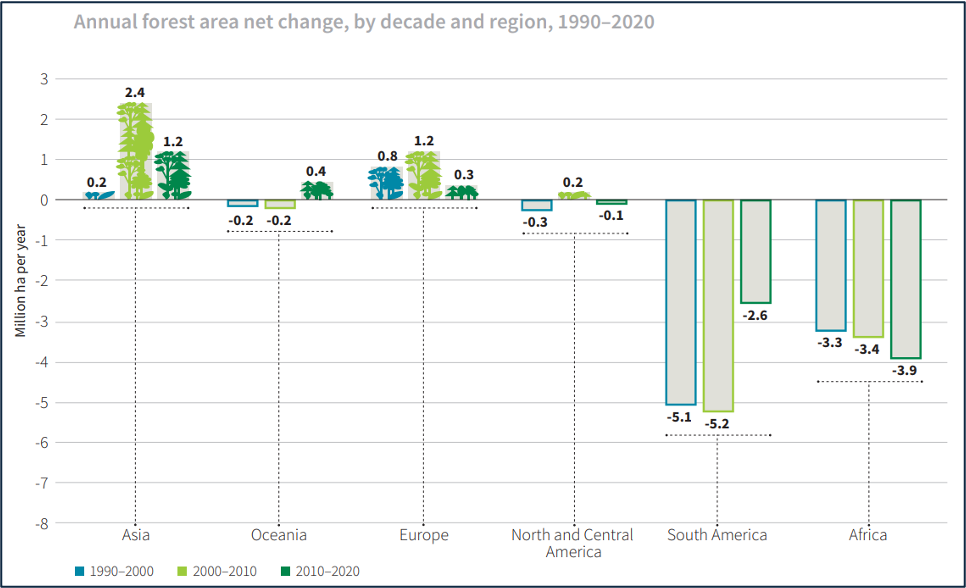
Source: FAO 2020: 3.
In some contexts, such as Indonesia, deforestation rates are highly politicised (Cisneros et al. 2021). Politicians often underestimate public demand for meaningful policy responses as there are strong societal concerns about climate change and pollution, as well as clear evidence of rising deforestation (Global Forest Watch 2024; Hsiao and Kuipers 2025). This politicisation also affects data quality, and consequently estimates of corruption-related revenue losses as governments may have incentives to underreport deforestation and associated revenue losses in official statistics to avoid domestic backlash and external pressure from donors, investors or multilateral institutions, further complicating efforts to produce reliable estimates.
Deforestation is driven by multiple factors that vary across local contexts. For example, Global Forest Watch (2024) distinguishes between drivers of deforestation and drivers of temporary disturbances. In Indonesia, for example, the former includes permanent agriculture, settlement expansion and infrastructure development, while the latter can involve logging, wildfires and shifting cultivation, among other factors (Global Forest Watch 2024). More broadly, typical drivers of deforestation include:
- economic development
- expansion of large-scale commercial agriculture
- urban expansion
- infrastructure and mining (FAO and UNEP 2020; FAO 2020; UNODC 2023).
For example, some estimates suggest that 60% of tropical forest loss between 2013 and 2019 was driven by commercial agriculture, with nearly three-quarters of this conversion occurring in violation of national laws and regulations (Dummett and Blundell 2021: 2).
Forest degradation, on the other hand, is driven by:
- timber logging, which can also contribute to deforestation, when done without regard to sustainability (see Climate Impact Partners 2025)
- fuelwood charcoal
- livestock grazing in forests
- uncontrolled fires (UNODC 2023: 12)
- small-scale harvesting when carried out unsustainably (Shapiro et al. 2023).
Corruption is another critical driver of forest loss. Because 73% of the world’s forests are publicly owned, under-resourced forest management agencies, often lacking adequate financial and human capacity, create opportunities for high-level corruption and capture by vested private interests (UNODC 2023: 7; Interpol 2016). Moreover, the immense economic value of forest land attracts criminal actors (UNODC 2023; 2024).
The consequences of corruption in the forest sector are extensive. They include: significant revenue losses; threats to the livelihoods of forest-dependent communities; market distortions in the timber sector; and major leaks of public resources, particularly tax revenues (UNODC 2023; 2024; 2025; Blundell and Harwell 2010; Transparency International 2012; Bösch 2021; Moreira-Dantas and Söder 2022). For instance, Tacconi and Williams (2020) observe that in industrial forestry, corruption can influence the zoning of forested land for conservation and logging land uses, and lead to the allocation of logging licences based on political connections.
However, estimating corruption-related revenue losses in the forestry sector is challenging for several reasons, such as the lack of reliable and comparable data on corruption crimes and underestimated corruption levels from existing data, among others (see UNODC 2023; Schütte and Syarif 2020).
This Helpdesk Answer is structured as follows: the next section outlines the key structural drivers of corruption in the forestry sector, along with the main actors involved and the principal forms of corruption; the section after that reviews available estimates of corruption-related revenue losses. The final section examines oversight mechanisms for addressing corruption risks in the forestry sector, focusing on key regulations, potential measures and recent data driven and artificial intelligence (AI) based solutions.
Drivers, actors and forms of corruption in the forestry sector
This section first examines the common structural drivers of corruption in the forestry sector. It then identifies the key actors involved in corrupt networks and highlights where corruption typically occurs along the supply chain. Finally, it outlines the most prevalent forms of corruption in the forestry sector in general, and illegal logging in particular, illustrated with relevant case study evidence.
Structural drivers of corruption and key actors involved
Local context is crucial when examining the structural drivers of corruption in the forestry sector (e.g. InSight Crime 2022). For example, a study on deforestation and illegal logging in Peru identified overlapping interests, entrenched informal relations and a lack of political representation as key drivers of the corruption occurring in the sector (Gianella et al. 2021). Specifically, Gianella et al. (2021) showed that overlapping interests, stemming from timber barons’ involvement in the political and administrative management of the region’s forests, were a major driver of corruption. Deeply embedded informal relations between logging companies, public officials and residents further sustain illegal logging operations, while an inadequate quota system for Indigenous representation limits the ability of Indigenous groups, who are disproportionately affected by land grabbing and illegal logging in rural areas, to promote their interests in the national parliament (Gianella et al. 2021: 11-14). InSight Crime (2022) notes additional drivers of corruption in Peru, including cattle ranching and agricultural activities, typically facilitated through land grabbing.
Therefore, the structural drivers of corruption in the forestry sector are not only complex but also highly variable over time, depending on the location, the types of commodities involved and the specific illegal activities (FAO and UNEP 2020: 93).
Nonetheless, the literature highlights several common structural drivers of corruption in the forestry sector (UNODC 2023: 13; Interpol 2016: 8), including:
- the high economic value of land and forest resources (e.g., profitable palm oil plantations require access to land) (Transparency International 2023; Jong 2023)
- the geographical remoteness of many forest areas, which limits effective oversight and enforcement
- the involvement of multiple governance stakeholders, complicating coordination
- often ineffective legislation and protections (e.g. few convictions limiting the deterrence effect; inconsistent forest laws)
- a lack of transparency in issuing licences and permits, which undermines public accountability for forest management
- unclear land tenure rights, creating opportunities for forgery of documents and bribery of public officials
- the large share of publicly owned forest land globally, making it vulnerable to state capture
- low salaries among forest law enforcement officers
Given these complexities, UNODC (2023: 20) underscores the value of political economy analysis for mapping networks of key stakeholders, their interests, constraints, and opportunities for corruption. The forestry sector includes a wide range of actors at both national and international levels who may engage in corruption (Navarro Gómez 2019; Hrynyk et al. 2023; UNODC 2023; 2025). At the national level, these include:
- legislators
- local governments
- national and local administration agencies
- national and local administration forest authorities
- national and local administration environmental authorities
- national and local authorities mandated to manage protected areas
- customs agencies
- police
- anti-corruption authorities, and others (UNODC 2023: 21-22)
On the supply side, involved actors may include private companies and organised crime groups (Hrynyk et al. 2023; UNODC 2025). The latter reportedly resort to threats, violence and bribery to silence opposition and secure collusion from residents, companies and state officials to access forest resources (UNODC 2025: 44). According to UNODC (2025), the involvement of businesses in forest crimes may range from unintentional to intentional (Figure 2).
Figure 2: Corporate engagement in forest crime.
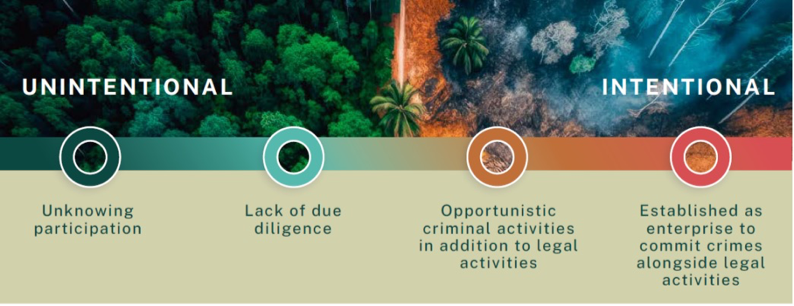
Source: UNODC (2025: 11).
Key actors in corrupt forestry networks (Gan et al. 2016; Anonymous 2018) vary depending on the context and the nature of the activity. According to an Interpol (2016) report, government officials from forestry agencies are the individuals most frequently implicated in corruption cases, but the report also highlights the involvement of officials from other government bodies, law enforcement personnel and representatives of logging companies, underscoring the networked and often high-level nature of corruption in this sector.
Additional actors may include armed militias, organised crime groups, local officials, consultants and others (Interpol 2016: 10). In Peru, for example, a study of more than 1,000 forest transport permits in 2017 identified key participants in timber laundering networks and documented various corruption risks, including failures to conduct background checks on forestry contract holders (Navarro Gómez 2019). May (2017: 71) notes that criminal actors may engage in illegal logging in numerous ways, ranging from harvesting protected species and logging outside concession boundaries to establishing fictitious plantations, but most schemes rely on some form of deception and/or bribery.
Corruption can occur at multiple levels of the forest management planning system (Figure 3). For example, UNODC (2023) distinguishes between corruption at the strategic planning level (influencing the policy formation, i.e. state capture), at the tactical planning level, concerning the implementation of rules (e.g., abuse of office) and at the operational planning level (including manipulation of construction standards, environmental requirements and related processes).
Figure 3: Corruption risks at different stages of forest management planning.
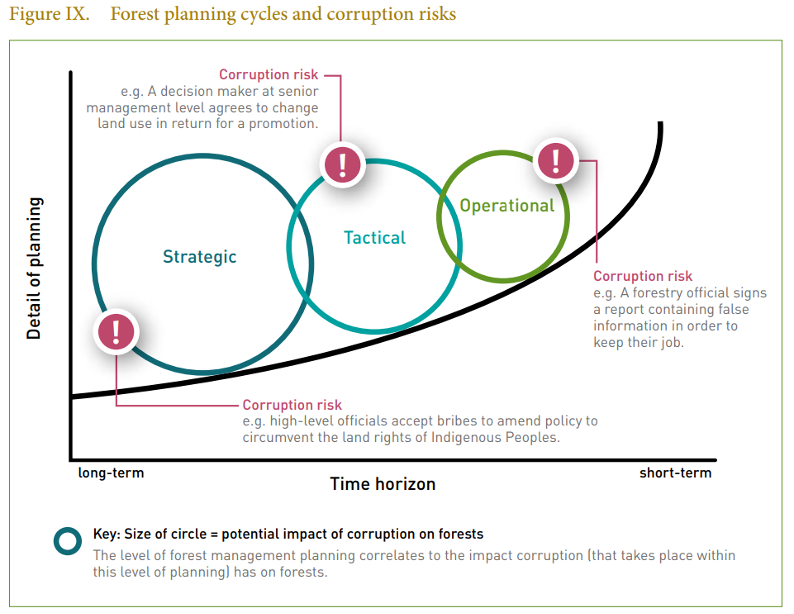
Source: UNODC (2023: 26).
Forms of corruption
Corruption in the forestry sector takes many forms, ranging from petty to high-level, as illustrated by numerous case studies (see Box 1). Corruption not only enables actors to profit from illegal activities but can also provide access to ostensibly legal ones by, for example, paying bribes to obtain official logging licences (UNODC 2023: 14; Meehan and Tacconi 2017).
Its manifestations vary across regional, national and local levels and include high-level corruption (state capture: influencing the formation of laws, rules and regulations), bribery to secure selective enforcement or obtain permits, trading in influence, embezzlement and other practices. Common forms include:
- Bribery: Interpol (2016), drawing on a database of reported corruption cases and surveys of law enforcement officials, found bribery to be the most prevalent form of corruption in the forestry sector (see also: Government of Mongolia n.d.; Blundell and Harwell 2010; Sundström 2016)
- Abuse of office: this typically involves misusing official authority to influence the issuance of logging permits or manipulate forest conservation policies (Interpol 2016: 9; UNODC 2023: 34)
- Nepotism: for instance, granting preferential access to forest-use contracts to relatives of public officials (Government of Mongolia n.d.: 1)
- Rent seeking: in Colombia, cattle ranching, illegal logging, timber trafficking and illicit crop cultivation have been identified as key drivers of deforestation. In rural areas, organised crime groups finance their activities through illegal rents generated by these economic operations such as through the illicit appropriation of state-owned land, land grabbing and control over access to forest resources, rather than through productive investment (UNODC 2023: 14; Murillo-Sandoval et al. 2023). Corruption facilitates these deforestation drivers by enabling the manipulation or illegal issuance of permits and tolerating illegal land conversion, allowing actors to capture economic gains derived from public resources (UNODC 2023: 14).
- Institutionalised corruption: following the centralisation of forest management in Indonesia in 1998, district chiefs were granted extensive powers to lease land for development. This led to widespread abuse, including the issuance of licences to politically connected businesses (UNODC 2023: 34)
- State capture: this may involve politicians being bribed by domestic and multinational corporations to influence legislation, such as lowering due diligence standards for importing forest risk commodities (UNODC 2023: 35)
Box 1: From bribery to state capture in the forestry sector
Numerous case studies document a wide range of corruption practices in the forestry sector, involving actors such as oligarchs, elected officials, forest sector officials, procurement officials and others.
In Indonesia, a palm oil tycoon, Surya Darmadi, was sentenced in 2023 to 16 years in prison and fined US$144 million for his role in deforesting thousands of hectares in Sumatra (Transparency International 2023; Jong 2023). He was found guilty of bribing elected officials to convert thousands of hectares of forests into palm plantations (Transparency International 2023). The tycoon was also found guilty on money laundering charges (Jong 2023).
In Romania, the head of a regional forest directorate was convicted of bribery for coercing employees of the public agency into making annual payments in exchange for keeping their jobs (UNODC 2023: 28)
In Indonesia, one governor received a prison sentence for circumventing logging licence regulations to issue permits to 11 companies linked to him, despite their failure to meet legal requirements. The licences facilitated the clearing of forest land for palm cultivation (UNODC 2023: 36).
In Indonesia, by 2016, the Corruption Eradication Commission (KPK) had brought 30 defendants to court for abuse of power and/or bribery related to forestry licence issuance across four provinces. All defendants were convicted on at least one charge (Schütte and Syarif 2020).
A study of Mongolia identified that kickbacks are common in the awarding of government tenders for forest related work, estimated at 5% of the contract value being paid back to officials (Government of Mongolia n.d.).
Illegal logging
Illegal logging refers to the “harvesting, transport, purchase, or sale of timber in violation of laws” (FAO and UNEP 2020: 93). However, definitions vary across countries, shaping the scope of what is officially counted as illegal logging. For example, Hrynyk et al. (2023: 20) note that Ukrainian legislation does not provide a comprehensive definition of illegal logging, with official statistics capturing only logging conducted without permits.
Illegal logging is widespread across tropical forest regions, with Brazil, Indonesia and Malaysia serving as major suppliers of both legal and illegal tropical timber (Gan 2016: 41). These activities not only deprive countries of significant revenues but also undermine international and domestic commitments to sustainable development and climate change mitigation (World Bank 2019). While not all illegal logging is linked to corruption, case studies from multiple contexts and time periods show that it is often facilitated by corrupt officials (Box 2). Illegal loggers often employ techniques similar to trade misinvoicing to disguise the quantity, value, quality and origin of timber and to enable laundering (May 2017: 71; see Figure 4). One example involves over-invoicing legal timber shipments to conceal the transport of illegal timber, followed by under-invoicing official sales to permit the harvesting of additional volumes without scrutiny (May 2017: 71).
Box 2: The role of corruption in illegal logging
Illegal logging is frequently facilitated by corruption, involving broad networks of actors, spanning public and private sectors and illicit groups.
Using social network analysis, Baker (2020) mapped a corruption network in Pelalawan district in Indonesia where local authorities fraudulently issued permits in violation of the forest ministry’s instructions. The study found that forestry corruption networks involve a large number of actors and are dominated by private-sector forestry interests and state officials (Baker 2020).
In Malaysia, a civil servant was arrested in 2024, on suspicion of receiving a bribe from a logging company in exchange for not following up on reported illegal logging (FMT 2024). In 2017, four individuals from logging companies were detained in relation to the bribery of state forestry department officials in Malaysia (Zakaria 2017).
A mayor in Peru was arrested for involvement in drug trafficking through plywood shipments. He controlled a timber business and strategically built a network for bribing officials to facilitate the movement of illegally harvested timber out of the country (Interpol 2016: 8).
In Ukraine, field research combined with satellite imagery exposed illegal logging in the Dubky forest, yet law enforcement took no action despite clear evidence (Hrynyk et al. 2023: 39).
Estimating corruption-related revenue losses in the forestry sector
There are broadly two types of studies that estimate revenue losses in the forestry sector:
- studies that assess revenue and other economic losses in the sector, some of which may be related to corruption (e.g. May 2017; World Bank 2019; Damnyag et al. 2024)
- studies that estimate revenue and other forms of economic losses specifically attributable to corruption (e.g. Interpol 2016)
Several distinctions within this literature are noteworthy. First, both groups contain global, regional and country-level estimates. Second, most studies focus on illegal logging and, while they often acknowledge the role of corruption in this process, only a few attempt to isolate losses directly caused by corruption. Third, although some research examines revenue losses such as foregone taxes due to illegal logging (e.g. World Bank 2019), most studies quantify the share of illegal logging in total production rather than estimating fiscal impacts.
These studies must overcome several methodological challenges. As Gan et al. (2016: 52) points out, existing estimates of illegal logging and related timber trade vary substantially due to differences in the scope of estimation (including time periods and types of products), definitions of illegality, data sources and estimation methods.
Measuring the role of corruption in revenue losses within the forestry sector is particularly difficult. First, reliable, open-data-compliant information on corruption offences is scarce. For example, UNODC (2025: 31) observes that administrative crime statistics on forest crimes are limited, with the United Nations Survey of Crime Trends and Operations of Criminal Justice Systems (UN-CTS) being the only consolidated source, based on the data submitted by member states.7829619f46cb
Second, even when data exists, corruption is likely severely underestimated because many corruption-related offences go undetected.
Third, although some studies highlight the potential of using conviction data and case files to identify types of corruption and estimate losses to the state budget (Schütte and Syarif 2020), such data is rarely available, frequently of poor quality, contain significant gaps (e.g. missing data) and are not available in machine-readable formats. Additionally, the estimates of state losses are often different across institutions and objective challenges further complicate assessment efforts (Schütte and Syarif 2020). For example, it is more difficult to estimate fiscal losses in areas officially classified as forests but characterised by low-quality timber or designated for conversion (see Schütte and Syarif 2020: 19).
While the literature offers few concrete recommendations for improving estimates of corruption-related revenue losses in the forestry sector, the weaknesses discussed above can help inform targeted measures to improve the quality of estimations. These include the standardisation of administrative data formats across forestry authorities, customs, tax administrations and other relevant agencies to enable systematic cross-checking of data. Expanded use of satellite imagery and remote sensing, combined with administrative and trade data, could further help identify discrepancies between reported and actual forest loss, providing more reliable baselines for estimating fiscal impacts. Some important data and AI driven initiatives in this area are discussed in the final section of this Helpdesk Answer. In addition, improved data sharing and coordination among forestry authorities, financial intelligence units and anti-corruption agencies could facilitate linking illegal logging patterns to financial flows and corruption cases.
Estimates of revenue losses in the forestry sector which may include corruption
Gan (2016: 43, 56-57) notes that statistics on illegal forest activities are difficult to find and, as a result, indirect methods are often used to estimate both illegal logging and related timber trade. These methods typically include:
- Trade data discrepancies, referring to export/import discrepancies between trade partner countries. Discrepancies may result from various factors, such as imports being recorded as “cost, insurance and freight” and differences in product classifications. Therefore, while discrepancies may suggest unreported trade, they do not constitute definitive evidence of illegal activity. But, if there are persistent differences in combination with additional evidence, they may point to high risks of illegal timber trade.
- Wood balance analysis is a widely used method that compares timber inputs (production plus imports) with outputs (exports plus domestic consumption) at the country or regional level. Although useful for estimating the scale of illegality, this approach has limitations and may underestimate illegal logging, depending on how production is measured.
- Import source analysis is based on estimating illegal trade by multiplying the estimated illegal logging rate in a source country by trade volumes in official statistics. This method relies heavily on illegality estimates derived from literature, surveys and stakeholder interviews, which may be imprecise or outdated.
- Expert surveys about perceptions of illegality in producer countries for estimating illegal logging.
- Hybrid methods are based on a combination of any of the above methods.
For example, Chatham House employed a combination of these methods, including trade data discrepancies, wood balance analysis, analysis of trade data for both exporting and importing countries and expert perceptions survey, to estimate the scale of illegal logging in its 2015 report, which covered 19 countries (Hoare 2015).
Several notable studies have attempted to estimate revenue and other types of losses in the forestry sector, though the vast majority focus specifically on illegal logging.
World Bank (2019)
The 2019 World Bank report estimates that illegal logging, fishing and wildlife trade together generate a combined annual value of US$1 trillion or more, with governments in 56 source countries losing an estimated US$7 billion to US$12 billion each year in potential revenue (see also World Bank Group 2019).
The report begins by comparing data from three other studies (Nellemann et al. 2014; Nellemann et al. 2016; May 2017) to estimate the value of illegal logging, placing it between US$30 billion and US$157 billion annually (World Bank 2019: 15).
To estimate economic losses, the report considers activities such as illegal logging in protected areas and the trade of illegally sourced timber (World Bank 2019: 10). It calculates that foregone tax revenue from illegal logging amounts to between US$6 billion and US$9 billion per year (World Bank 2019: 19). The analysis applies the Chatham House methodology for estimating the size of the illegal timber market, drawing on multiple data sources, including (World Bank 2019):7a5a3daee7e2
- wood balance analyses (i.e. comparisons of reported production, consumption, and exports, and reported imports)
- independent forest monitors’ reports
- national expert-based surveys
- satellite data
- studies from other organisations (World Bank 2019: 41)f21fb4de9f91
The report provides estimates for different regions and for the six largest producers. For Indonesia, it estimates that 56% of total production is illegal and that aggregate tax revenue foregone in 2017 due to illegal logging amounted to US$1.804 billion (World Bank 2019: 43). Across the 56 countries included in the study, the estimates range from US$6.1 billion to US$9 billion (World Bank 2019: 43).
Although the report recognises corruption as a facilitating factor (World Bank 2019), it does not isolate the share of losses attributed solely to corruption.
Chatham House (Hoare 2015)
The report is part of a multi-year Chatham House project launched in 2006 to monitor progress in global efforts to address illegal logging and improve forest governance (Hoare 2015). While the first assessment covered 12 countries, the 2015 report expanded the scope to 19 producer, processing and consumer countries selected for their significance in the global forest sector.
The analysis relied on indicators designed to capture both the broader governance environment and the levels of illegal logging, drawing on a variety of methods and data sources. These indicators included:
- media attention to illegal logging and related trade, measured through reviews of international and domestic media coverage
- government response, assessed by analysing national policies and legal frameworks (both design and implementation), enforcement data, forest revenue data and expert perceptions surveys
- private-sector response, evaluated through data on voluntary legality verification and sustainability certification, analysis of trade data to assess shifts in trade between “sensitive” and “non-sensitive” markets and expert perceptions survey
- Levels of illegal logging and related trade, assessed using trade data discrepancies, wood balance analyses, analysis of trade data for both exporting and importing countries and expert perceptions survey on the scale of illegal logging (Hoare 2015: 3)
The report examined progress from 2000 to 2013 across a set of 19 countries, including nine producer countries (Brazil, Cameroon, DRC, Ghana, Indonesia, Laos, Malaysia, PNG, Republic of the Congo), three processing countries and seven consumer nations (Hoare 2015). It found that although illegal logging declined in the first decade of 2000s, progress slowed since 2010, and the bulk of timber production in assessed countries remained illegal (Hoare 2015: 11). Drawing on various data sources, Chatham House estimated that the vast majority of illegal timber in 2013 came from Indonesia (approximately 50%) and that the estimated percentage of illegal timber in the total timber production in Indonesia was 60% in 20132ffb8ef9f4e9 (Hoare 2015: ix, 12).
Figure 4: Estimates of legal and illegal timber production in the nine producing countries.
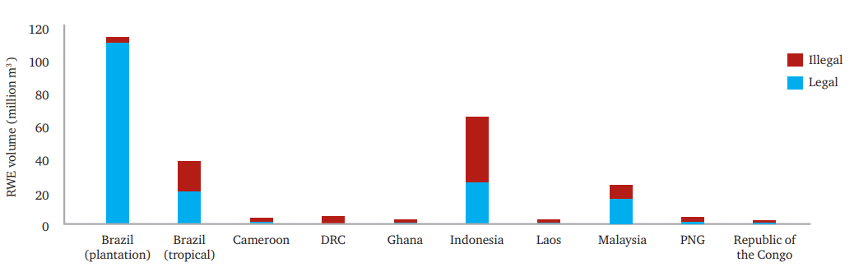
Source: Hoare (2015: 11). The data in the graph comes from variety of sources, which include “illegality estimates by Chatham House; and official national trade statistics for Brazil (AliceWeb); Cameroon (Association Technique Internationale des Bois Tropicaux [ATIBT]); Forestry Commission of Ghana; Indonesia (Badan Pusat Statistik); Malaysian Timber Industry Board and Department of Statistics Malaysia. Trade statistics for Laos, Republic of Congo, the DRC and Papua New Guinea are based on corresponding import data for partner countries. Data for all nine producer countries also draw on UN Comtrade, ITTO production data and on analysis by Chatham House” (Hoare 2015: 11).
Like other global or multi-country estimates about illegal logging, this report also did not try to estimate the extent of corruption in illegal logging.
Other regional and global estimates
There is a range of other regional and global estimates. Gan (2016: 43) identifies several attempts to estimate illegal logging and the related timber trade, most of which focus on illegal production and trade of timber for commercial use (see Hoare 2015; Seneca Creek Associates and Wood Resources International 2004).
According to one such estimate (Seneca Creek Associates and Wood Resources International 2004), the annual value of suspicious (likely illegal) primary wood products produced worldwide was US$22.5 billion, of which US$5 billion was internationally traded, constituting 10% of the global trade value of primary wood products in 2002 (Gan 2016: 45). Yet these estimates vary widely in their time periods, methods, product categories and geographic coverage, making them difficult to compare directly (Gan 2016: 45).
Gan (2016: 47) employs an import source analysis: multiplying estimated illegal logging rates in producer countries by trade volumes reported in the United Nations commodity trade statistics database and focuses on five key producer regions and two products (roundwood and sawn wood). The approach excludes trade flows of finished and semi-finished products and does not account for domestic illegal trade. Gan (2016: 47) estimates that the trade value of these products at high risk of illegality totalled US$6.3 billion in 2014 (representing 42% of total exports from producer countries). The estimated value of exports of illegally sourced roundwood and sawn wood from Southeast Asia (Cambodia, Indonesia, Laos, Malaysia and Myanmar) was estimated at US$3.5 billion in 2014, of which approximately 50% was imported by China (Gan 2016: 50).
Further, Lawson (2014) estimated that almost half (49%) of tropical deforestation between 2000 and 2012 resulted from illegal clearing for commercial agriculture. According to the report, this was especially pronounced in Brazil and Indonesia, where an estimated 90% and 80% of deforestation, respectively, was illegal. Although the report does not quantify the role of corruption in these activities, it highlights that much forest conversion occurs within contexts marked by complex, contradictory and weakly enforced regulations, conditions that enable actors to break the law with impunity (Lawson 2014). The report further observes that, despite regional variation, high-level corruption in the issuance of licences for forest conversion for commercial agriculture is widespread across the countries analysed (Lawson 2014: 2).
Further, some estimates suggest that governments in tropical countries lose around US$5 billion each year to tax and royalty evasion on legal logging activity (Castrén and Pillai 2017: 372; Verhoeven et al. 2019). Another estimate suggests that countries in tropical areas may be collecting only 20% of the forestry-related revenue (UNODC 2023: 16).
Country-level estimates
There are numerous country-level estimates, most of which focus on illegal logging. Although these studies acknowledge the role of corruption in such activities, only a few attempt to isolate theshare of revenue or other losses attributable specifically to corruption (Box 3).
Box 3: Country-level estimates of illegal logging-related losses
One study suggests that nearly 20% of the proceeds from a typical transaction per cubic metre of Russian timber (focused on softwood) at the Russia-China border is spent on bribery (May 2017; Felbab-Brown 2011: 17) (Figure 6). Recent data further indicates that, despite sanctions on Russian products, over €1.5 billion worth of Russian timber has been smuggled into the EU since June 2022 through third countries (Canby 2025; Earthsight 2025). Some of the companies involved are linked to billionaire oligarchs (Earthsight 2025). Estimates also suggest that 15% to 50% of timber harvested in Russia may be illegal (Canby 2025).
Guevarrato (n.d.: 37), drawing on analysis from different regions in Indonesia, identifies several forest management issues, manifesting in the calculation of non-tax revenue, illegal collection of levies and inadequate oversight of timber flows from forests to industry that suggest significant potential revenue losses. Guevarrato (n.d.: 16) cites the study of the Corruption Eradication Commission (KPK), which estimated state losses from the forestry sector between 2002 and 2014 to be approximately US$9 billion. However, the author notes that the lack of valid records of the Ministry of Environment and Forestry facilitates the manipulation of reports on timber production (Guevarrato n.d.: 16). The study also documents conflicts between locals and companies over land rights, the imposition of illegal levies and non-transparent permit issuance processes (Guevarrato n.d.). Although the author acknowledges the role of corruption in these dynamics, the estimates do not systematically differentiate between revenue losses attributable to corruption and those arising from other factors. The study is further valuable for highlighting data challenges, including inconsistencies between data across different domestic institutions and discrepancies between international and domestic estimates of forest land coverage (Guevarrato n.d.).
A study by Damnyag et al. (2024) estimated stumpage,6276e67d5bcf social responsibility agreements and carbon revenue loss from the informal timber sector in Ghana. The findings are relevant from an anti-corruption perspective as timber in Ghana is reportedly illegally sourced through collusion between forest resource managers and timber contractors, among other mechanisms. The study examined 13 forest districts in Ghana and relied on secondary data on quantities of confiscated timber from illegal logging between 2020 to 2022 (Damnyag et al. 2024: 18). For example, they estimate the loss in annual stumpage revenue resulting from the confiscated illegal timber between 2020 and 2022 to be approximately US$14,670 (Damnyag et al. 2024: 21). The paper estimated the revenue losses or leakage resulting from confiscated illegal timber and found that a large share of illegally harvested timber originated from districts either within an emission reduction programme area or located in fragile ecological zones (Damnyag et al. 2024: 25). Although the study notes the role of corruption in facilitating illegal logging in Ghana,the revenue estimates do not isolate losses specifically attributable to corruption, but instead provide an aggregate figure linked to illegal logging more broadly.
Figure 5: The estimated share of bribery in timber trade at Russia-China border.
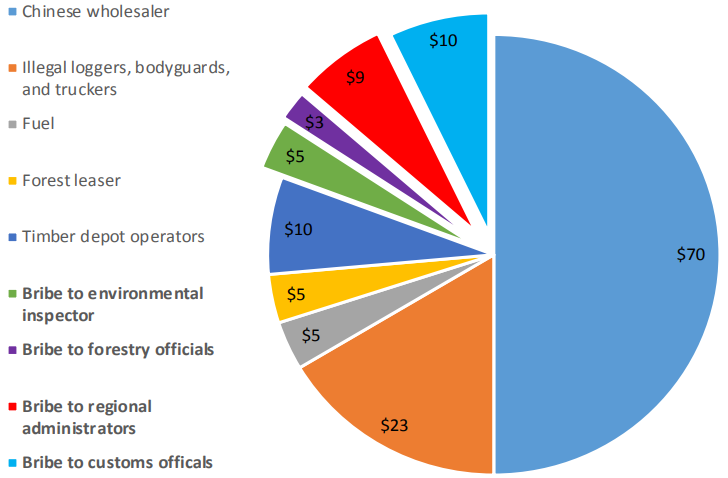
Source: May (2017: 70).
Estimates of revenue losses in the forestry sector specifically related to corruption
There are very few studies that specifically examine the role of corruption in estimating revenue and other forms of losses in the forestry sector. Those that do either lack a clear methodological description or analyse only broad cross-country correlations between corruption and forest loss, relying on distant proxies for corruption.
A widely cited Interpol (2016) report estimates the annual global cost of corruption in the forestry sector at around US$29 billion, but it does not provide a clear methodological explanation behind this estimate (see also UNODC 2023).
Cross-national studies on corruption and forest loss have generally found that higher levels of corruption are associated with greater forest loss (e.g., Meyer et al. 2003; Laurance 2007; Koyuncu and Yilmaz 2009). However, as Sommer (2018a) notes, there have been some contradictory findings: some studies report no relationship between corruption and forest loss (Shandra et al. 2011), a discrepancy often attributed to the absence of robust theoretical frameworks and the lack of sufficiently disaggregated data (Meehan and Tacconi 2017).
Using data from 87 low and middle-income countries, Sommer (2017) examined the effects of grand corruption in the executive branch and petty corruption in the public sector on forest loss between 2001 and 2014. The study used novel data about forest loss based on satellite imagery from the World Resources Institute Global Forest Watch webpage and measured corruption using Varieties of Democracy indicators for executive and public sector corruption (Sommer 2017: 6-7). The findings indicate that both grand and petty corruption affect forest loss, but their impact sizes are smaller than those of some other variables like rural population growth and economic growth (Sommer 2017: 9). A follow-up study (Sommer 2018a) focusing on specific forms of corruption found that embezzlement, bribes, theft and corrupt exchanges all contribute to increased forest loss (see also Cozma et al. 2023).
Further, Sommer’s (2018b) study, specifically focused on state spending and forest loss, hypothesised that higher state expenditure in high and middle-income countries would result in better regulation of forest loss due to their ability to allocate resources for forest protection, but only in contexts with a certain quality level of governance. In line with this expectation, this study, based on a sample of 97 middle and high-income countries, showed that as state spending and quality of governancee2a1ef848664 increase, the forest loss declines (Sommer 2018b: 22; see also Sommer 2022; Moreira-Dantas and Söder 2022).
Meehan and Tacconi (2017) developed a frameworkf0f8e1aca917 to assess the impact of corruption on forests, focusing on Indonesia’s forest sector. Drawing on field research and semi-structured interviews, the framework evaluates how corruption manifests at different stages of forest management and examines its effects in three key areas:
- land-use planning
- awarding concession and permits to use forests
- monitoring and enforcement
Oversight mechanisms
As discussed earlier in this Helpdesk Answer, corruption in the forestry sector takes many forms and involves broad networks of actors at both domestic and international levels. Local context plays a critical role in shaping these networks and influencing which corrupt practices emerge, and consequently no single policy solution can address all corruption forms within the sector (UNODC 2023: 43).
Over the years, gradual improvements have been made to strengthen oversight of the forestry sector, particularly logging, to enable the early detection of illegal activities. While not normally framed as such, these measures can all conceivably play into reducing the revenue losses caused by deforestation facilitated by corruption.
A range of regulations and measures have been introduced by consumer countries and entities such as the EU and the US, alongside governance reforms in producer countries aimed at reducing the market for illegal timber (Hoare 2015; Gianella et al. 2021; Li et al. 2025; WWF 2022; Castro 2024). These developments have been complemented by new artificial intelligence (AI) driven tools designed to support the early detection of corruption risks in the forestry sector (Hoare 2015; Gianella et al. 2021; Li et al. 2025; WWF 2022; Castro 2024).
Key regulations
In 2023, the EU adopted landmark legislation, the EU deforestation regulation (EUDR), which requires businesses to demonstrate that the products they either sell or export to the EU do not come from recently deforested or degraded land (Li et al. 2025). The regulation covers timber and six key agricultural commodities, including cattle, cocoa, coffee, oil palm, rubber, soy and products made from them. These products need to meet certain conditions to be sold in or exported from the EU market (the need to be deforestation-free; produced in compliance with the laws of the country of origin; and accompanied by a due diligence statement, demonstrating that companies have verified the origin and ensured compliance with EUDR requirements) (Li et al. 2025). The regulation applies to companies based both in the EU and internationally, and to businesses of all sizes, although large firms face stricter reporting obligations (Li et al. 2025).
While the EUDR is promising, its implementation has faced delays and pushbacks. In September 2025, the European Commission (EC) proposed postponing enforcement until December 2026, following a letter from EU agriculture ministers calling for simplification of the regulation (Li et al. 2025). In October 2025, the EC formally proposed to simplify EUDR for micro and small businesses (EC 2025). The European parliament voted in November to postpone EUDR implementation until the end of 2026, with a grace period for small businesses until 30 June 2027 (RFI 2025; Etzo 2025). Nonetheless, some private-sector actors have begun taking proactive steps toward compliance by, for example, integrating geodata documentation into their SAP systems to verify where and when each tree was harvested (Danzer 2024).
Further, as the FAO and UNEP (2020) report notes, there have been regional and country-level attempts over the past decade aimed at addressing illegal logging. For example, several consumer countries have introduced trade regulations requiring importers to demonstrate that timber has been legally harvested, such as the 2008 Lacey Act Amendment in the United States and Japan’s 2016 Clean Wood Act (FAO and UNEP 2020: 94; Momii and Saunders 2020).
Producer countries have also strengthened their legislation and safeguards. For example, Indonesia has implemented a national timber legality assurance system and became the first country in the world with the forest law enforcement governance and trade (FLEGT)b72b6471e296 licensing scheme, reflecting significant efforts to track timber legality and curb illegal trade (Forest Trends 2021). For example, in the first half of 2020, Indonesia ranked as the ninth biggest EU-27 trading partner of FLEGT products by value (UNEP-WCMC 2024: 2).
In Peru, USAID supported activities, although not directly aimed at countering corruption, had indirect effects by promoting institutional reforms, decentralisation (i.e. promoting compliance and aiding in more effective monitoring of the protected areas created within each regional jurisdiction), and civic engagement and dialogue around forest exploitation (Gianella et al. 2021). For example, the signing of the United States–Peru free trade agreement (PTPA) in 2009 contributed to a more integrated, cross-sectoral approach to environmental management in Peru, strengthening regulatory oversight and mechanisms to curb forest crime (Gianella et al. 2021).
As part of these reforms, new agencies were created – e.g. the Agency for the Supervision of Forest and Wildlife Resources (OSINFOR), tasked with monitoring forest concession holders and administering sanctions for contract violations – and the decentralisation of forest governance was also strengthened (Gianella et al. 2021). These institutional reforms in Peru particularly focused on the oversight of illegal logging in the Amazon (Gianella et al. 2021).
Anti-corruption oversight measures and tools
The UNODC (2023) proposes a range of measures tailored to different objectives, among which prevention and detection measures are particularly relevant for strengthening oversight in the forestry sector:
prevention: corruption risk management processes aligned with existing standards such as the International Standards Organization (ISO) 31000 risk management principles and guidelines (UNODC 2023: 44); tailored human resource management procedures; enhanced transparency (e.g., centralised online data platforms and unified spatial data, etc.); and strengthened due diligence processes
Detection: identifying red flags; monitoring forest loss using data driven approaches; ensuring compliance through audits; improving beneficial ownership transparency; and “following the money” by strengthening existing financial oversight protocols, improving inter-institutional information sharing, and implementing data harmonisation standards
Regarding prevention, UNODC (2023), for example, recommends that public organisations undertake corruption risk management processes due to the multifaceted nature of corruption in the forestry sector (Figure 7). This approach would allow public organisations to identify potential corruption vulnerabilities specific to their area of work within the forestry sector.
Transparency enhancing measures are also emphasised, such as developing centralised, open-data platforms containing detailed maps and registries of concessions, licences and permits (UNODC 2023). Such tools can help easily identify potential conflicts of interest, political favouritism and flag businesses with histories of irregularities (UNODC 2023).
Due diligence measures are also important for corruption prevention. For example, the UK government introduced the UK forest risk commodity regulation as part of its Environment Act of 2021 (Gaston Schul 2025).5e44f50af1cd This regulation is aimed at curbing illegal deforestation by requiring businesses with a global annual turnover of more than £50 million to prohibit the use of illegally produced forest risk commodities, establish a due diligence system and report annually on due diligence activities (Gaston Schul 2025).
Regarding detection, UNODC (2023), for example, suggests tracking forest loss using the national forest monitoring systems, relying on satellite data. One such tool is Independent Forest Monitoring (IFM), in which civil society and communities living in and close to forests monitor and report suspected illegalities in the timber sector (UNODC 2023; FAO 2021). IFM has proven effective in enhancing transparency and supporting forest law enforcement (FAO 2021). In Indonesia, such monitoring is conducted by stakeholders traditionally outside the timber value chain but nevertheless affected by it, including local communities, Indigenous groups and other marginalised communities (FAO 2021).
Transparency of beneficial ownership is another measure to facilitate the detection of corruption risks in the forestry sector, as well as following the money through specialised protocols. For instance, UNODC (2023: 54) suggests that protocols like customer due diligence and know your customer (KYC), which are employed in targeting terrorism financing and corruption, can be adapted to identify illegal money flows stemming from forest loss.
Figure 6: A visual representation of the ISO 31000 Corruption Risk Assessment and Management Process.
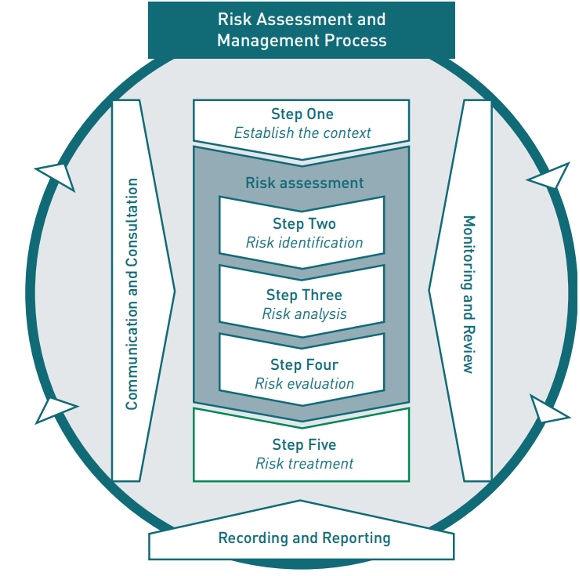
Source: UNODC (2023: 45).
Further, Interpol’s (2016: 11-12) report suggested, among other recommendations:
- clarification and harmonisation of forest laws
- consolidation of information held by different government agencies affecting land tenure
- transparency in issuing licences and permits, for example, through online permit systems, as well as in land tenure and property rights
Data driven solutions and the role of artificial intelligence (AI) in preventing corruption in the forestry sector
Data driven and AI based solutions (Box 4) are increasingly being used to monitor and detect corruption risks in the forestry sector. For example, in December 2024, the Ministry of Agriculture and Rural Development (MARD) in Vietnam launchedthe database system for forest and coffee growing areas with local and international partners, aimed at ensuring compliance with EUDR (IDH 2024).
The system relies on land-use planning maps, cadastral maps and production area details whose accuracy was checked with field surveys to establish a comprehensive traceability system capable of identifying any discrepancies and ensuring compliance with EUDR (IDH 2024).
Further,Forest Trends maintains a timber legality dashboard, which assesses countries on the basis of a combination of factors, including the existence of a legal framework on illegal logging as well as secondary scores related to governance and corruption risks.
Box 4: Harnessing AI to monitor corruption risks in the forestry sector
The existing literature demonstrates that AI has potential in the anti-corruption field, specifically with regards to preventing and detecting corruption (Resimić 2025). In recent years, there has been a growing number of AI driven tools to monitor and detect corruption risks in the forestry sector, and particularly with regards to illegal logging.
SUMAL 2.0, developed in 2021 by Romania’s Ministry of the Environment, Water and Forests is an application for improving traceability of woods, strengthening fraud detection and deterring illegal logging (UNDOC 2023: 51; Wallace 2025). It was introduced in response to significant weaknesses and loopholes identified in the earlier SUMAL system launched in 2014, as well as persistent enforcement gaps revealed after the creation of the Forest Inspector mobile app and online geoportal in 2016, which allowed real-time public access to SUMAL data (Wallace 2025).
The scale of Romania’s illegal logging problem had become increasingly evident, particularly after a 2019 analysis estimated that around 20 million cubic metres of wood are cut illegally each year (Roman 2019; Wallace 2025). Under Romanian law, each timber or lumber transport must be registered in SUMAL with detailed data, including the truck’s licence plate, wood species, volume and accompanying photographs, among other information. However, reviews by several organisations, including the Environmental Investigation Agency (EIA), found widespread non-compliance: as of 2023, more than a quarter of SUMAL 2.0 transport entries contained errors or irregularities, with repeated or “cloned” photos being especially common (Wallace 2025).
The EIA trained a convolutional neural network based machine learning model to determine whether submitted photos contained a visible licence plate, using it as a basic compliance check (Wallace 2025). The model was deployed on more than 50 million photos submitted to SUMAL 2.0 between January 2021 and May 2025. Although not perfectly accurate, it revealed alarming levels of non-compliance, with large numbers of submissions missing legally required information.
This analysis illustrates how AI can serve as a powerful quality control tool in data driven enforcement systems, enabling authorities, journalists and civil society to detect irregularities at scale, uncover past fraud and identify suspicious activity in real time.
The Dypterix project developed an algorithm that predicts high risks of illegality of Amazonian timber (Castro 2024). The team behind the project spent a year analysing over 2.5 million timber commercialisation data points to develop an algorithm to estimate the risk of it being illegal. They analysed data related to the timber trade and transport, forestry concessions, administrative sanctions, criminal investigations for environmental crimes, companies with records and customs exports (Castro 2024). The algorithm is based on a random forest classifier model, which generates risk predictions on a scale from 0 (no risk) to 1 (maximum risk) for three key actors in the timber trade: the owner of a forest concession, the buyer and the recipient. For example, in assessing the risk profiles of forest concession holders, the team analysed a group of 500 concession holders, and the model found that 25% of the documents used by this group to market and transport timber have a high risk rating (Castro 2024). Moreover, the algorithm found that more than half (55%) of traded timber by forest concessionaires in the Peruvian Amazon is at high risk of being illegal (Castro 2024).
Forest Foresight is an AI solution to detect the early signs of illegal deforestation, using historical geospatial data, satellite images and socioeconomic variables (WWF 2023; WWF Ecuador 2025). It was developed by WWF-Netherlands with commercial and academic partners, showing the ability to predict illegal deforestation up to six months in advance with 80% accuracy in pilot projects in Borneo and Gabon (WWF 2022; Resimić 2025: 26). Its key advantage is in enabling authorities to react proactively, avoiding irreversible losses (WWF Ecuador 2025).
- Ten countries have two-thirds of the global forest area (the Russian Federation, Brazil, Canada, the USA, China, Australia, the Democratic Republic of Congo, Indonesia, Peru and India (UNODC 2023: 23).
- UNODC (2023: vii) defines forest loss as deforestation (forest destruction) and forest degradation (a “reduction of the capacity of a forest to provide goods and services to people and nature”).
- For example, “between 20 and 47 Member States from ten world subregions submitted data during the bi-annual reporting to the UN-CTS on the number of acts that resulted in the depletion or degradation of natural resources, between 2014 and 2021” (UNODC 2025: 31).
- For details about the Chatham House methodology, see Hoare (2014).
- For further details, see World Bank (2019, Annex 1).
- For further details about the figure, see Annex 2 in Hoare (2015: 62).
- The study relies on the World Governance Indicators database by the World Bank to measure different aspects of governance quality (political stability, control of corruption, rule of law, government effectiveness and regulatory quality) (see Sommer 2018: 11).
- In the research for this Helpdesk Answer, no study attempting to apply this framework was located in the public domain.
- The FLEGT action plan was adopted in 2003, leading to two pieces of legislation, the EU timber regulation (2013) and the FLEGT regulation (EC n.d.). The latter entered into force in 2005 and was aimed at regulating the entry of timber to the EU from countries entering into voluntary partnership agreements (EC n.d.).
- The regulation requires secondary legislation to become operational, but there have been delays in this process (Gaston Schul 2025; Institute for European Environmental Policy 2025).
- The stumpage fee is “is a species-specific, volume-based fee charged on harvested timber” (Damnyag et al. 2024: 17).